


| Visual Basic |  Copy Code Copy Code |
|---|---|
|
|
| C# | Copy Code |
|---|---|
|
|
Remarks
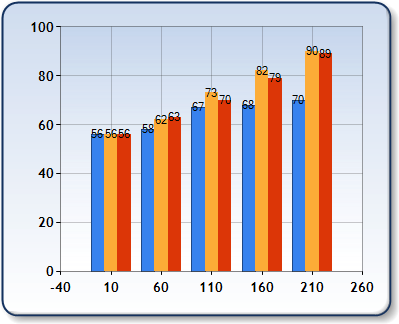
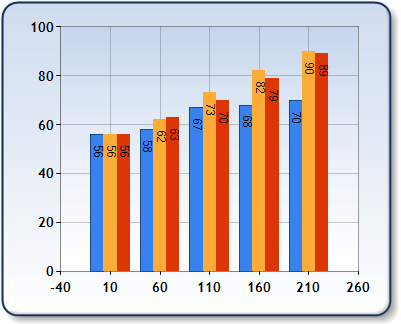
This custom attribute defines the orientation of data point labels within the series that it is applied to. Figure 1 below illustrates the effect of setting this attribute to a value of Horizontal, and Figure 2 displays the result of setting this attribute to a value of Vertical.
 |
|
Figure 1: A Column chart with its ColumnLabelStyle set to a value of Horizontal. |
 |
|
Figure 2: A Column chart with its ColumnLabelStyle set to a value of Vertical. |
| Custom Attribute Summary | |
|---|---|
| Possible Values: |
Horizontal - Data point labels are positioned horizontally at the top of the column. Vertical - Data point labels are positioned vertically within the column. |
| Default Value: | Horizontal |
| 2D / 3D Limitations: | 2D only |
| Applies to Chart Element: | Series Objects |
| Applies to Chart Types: | Column |