


Overview
This topic describes the various data-binding techniques, starting with the simplest methods to the most advanced. It also describes how to align data points, from different series, along the X axis using their axis labels.
 Note Note |
|---|
| We recommend that you use the summary table and the decision tree below to help you determine which data-binding method to use. |
The Summary Table
This table lists data-binding techniques, starting from the most basic method proceeding to more advanced. When used in combination with the decision tree below, it should help you to decide which method of data-binding is best to use for your application.
| Method | Advantages | Disadvantages |
|---|---|---|
|
Chart.DataBindTable |
|
|
|
Chart.DataSource and |
|
|
|
Points.DataBind(X)Y |
|
|
|
Points.DataBind |
|
|
|
Chart.DataBindCrossTab |
|
|
Data Sources
The following are the possible data sources used for binding:
-
DataView.
-
Data Readers (SQL, OleDB).
-
DataSet (DataSource data-binding ONLY).
-
Arrays.
-
Lists.
-
SqlCommand / OleDbCommand (DataSource data-binding ONLY).
-
SqlDataAdapter / OleDbDataAdapter (DataSource data-binding ONLY).
-
All IEnumerable objects.
| Note |
|---|
| When using non-tabular data sources such as lists, or arrays, only Y values can be bound with one method call, regardless of the type of data-binding method used. This is because columns cannot be specified for X values, and other chart properties (e.g. Tooltip etc.). |
The Decision Tree
Use this decision tree, along with the summary table above, as a guide to help you determine how to bind your data:
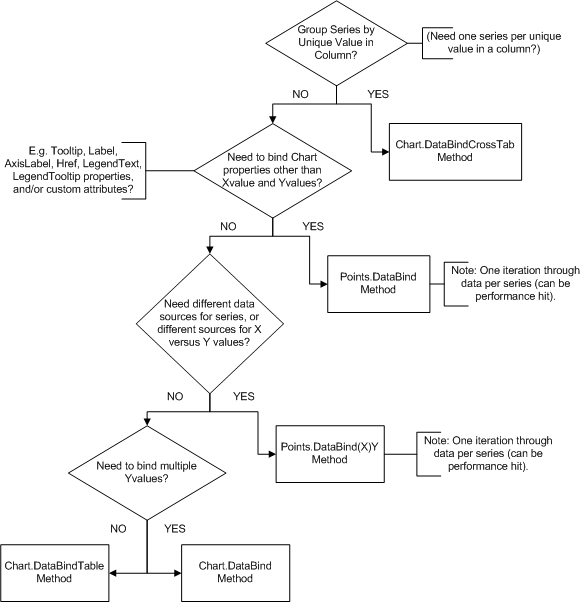
Figure 1: Decision Tree
Data Binding Options at Design-Time
Using VisualStudio 2005/2008
| Note |
|---|
| In the interest of brevity, the databinding options (and screen images) shown are those found in Visual Studio 2005, however those in Visual Studio 2008 are similar if not the same. |
When creating applications in ASP.NET 2.0 or later, you have the option of binding the chart to a data control instead of binding the chart directly to a database. This enables the clean encapsulation and abstraction of functionality within your application and eliminates the need to write any data access code in your presentation layer.
To add a datasource object to your application, use the following steps:
- Bring up the chart's Smart Tag by clicking on the arrow tab on the top-right corner (circled in red) of the chart.
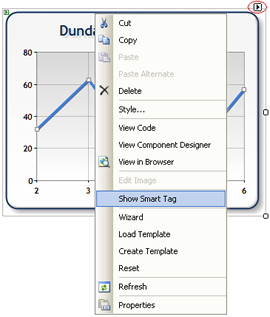
Figure 2: Using the smart tag functionality. - From the Data Source drop-down list, select Add Project Data Source... This will display the Data Source Configuration wizard.
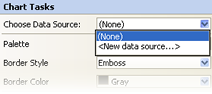
Figure 3: Choose New datasource.
- The Data Source Configuration wizard will guide you through the process of binding a data control to the chart. You will be prompted to select a particular method for display in the chart.
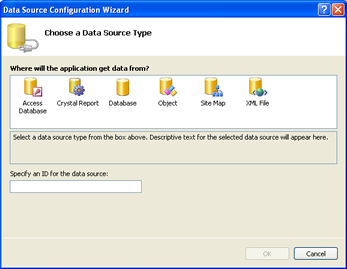
Figure 4: The datasource configuration wizard.
Once the datasource has been added to the application, you must assign the X and Y values (from the newly added Data Source) to the X and Y values of an existing chart Series.
To assign the X and Y values to your chart series, follow these steps:
- In the design editor, click on a Series, and click on the Smart Tag icon.
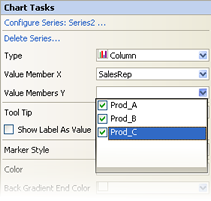
- Click on Configure Series:Series1... link to open the Chart Item editor.
- Under the DataSource category you will find the ValueMembersY, and ValueMemberX properties.
- From the drop-down list, select the table names that you want to include. For chart types that accept multiple Y Values, these multiple Y value members can be specified by checking off one, or more, entries from the ValueMembersY drop-down list.
Figure 5: Select the table name of your datasource.
Using The Chart and Data Wizard
Using the Chart and Data Wizard for creating charts cannot be any more simple. Start the wizard by clicking the wizard link from the Properties Dialog or from right clicking on the chart in the Design-Time.
Click on the Series Data button. The first step is to select the Chart datasource. All data sources available to the form will be shown in the drop down list. Select the appropriate one.
| Note |
|---|
| You also have the ability to create a database Connection and DataAdapter from the drop down list by choosing the New Binding Source... option. |
With a DataAdapter selected, you can confirm the connection, and view the data by selecting the Preview Data button. This will populate the Grid control.
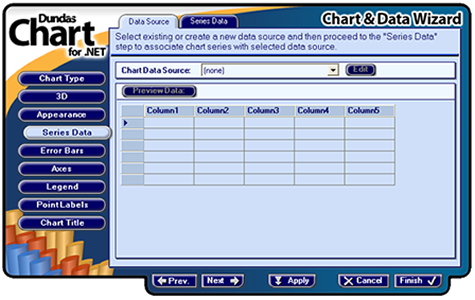
Figure 7: The Chart & Data wizard.
To assign the retrieved database columns to X and Y values of a Series, select the Series Data tab (at the top of the wizard). The Chart and Data Wizard will look like:
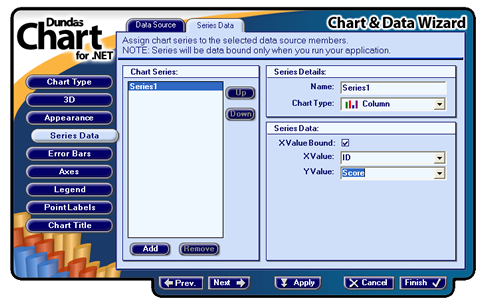
Figure 8: Setting series data using the Series Data tab.
Select the Series in the list control. The wizard now provides the ability to select the columns to associate with the X or Y values. If the selected series requires more than one Y Value, then additional Y Value drop down lists will be shown. By default, the X Value is not enabled for Data-binding, however, selection of the XValueBound checkbox will enable the drop down list. Any column can be bound to any number of series.
Using the Properties Dialog
When using the DataSource with the Properties Window, the configuration of the Connection and DataAdapter is the most difficult tasks. Using them with the chart is very simple. For most charts, this is a two step process:
- Assign the DataAdapter to the DataSource property by either typing the name of the object directly into the property field or by selecting it from the drop down list of available DataSources.
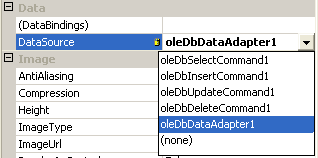
Figure 9: Select your DataAdapter from the dropdown list.
- Assign the X and Y values available from the selected DataSource to X and Y values for a selected Series. Open the Series Collection dialog and select the appropriate series. Scroll down in the Series property list to find the ValueMemberX and ValueMembersY properties. Selection of these properties will display a drop down list where you can select the column names or specify integer ordinals for the previously selected DataSource. Alternatively, for chart types that accept multiple Y Values, the ValueMembersY can be comma-separated names or ordinals.
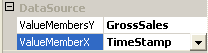
Figure 10: Set the ValueMember properties.
If the datasource is set at design-time, when your application starts it will automatically call the Chart.DataBind method.
Run-Time Data-binding Methods
The Chart.DataBindTable method is the simplest of all data-binding techniques. One, and only one, datasource can be used, and each column results in the creation of a data series. Each column entry results in the creation of a data point in that column's corresponding series, and is used for the first Y value of the point. One column can optionally be used for X values, if using the method definition that has an xField parameter.
Refer to the Summary table for a listing of this method's advantages and disadvantages.
Example
This example demonstrates how to bind a column chart to an Access database table. The table, named "SALESCOUNTS", has a "SalesRep" column with the names of the sales people, a "Prod A" column, a "Prod B" column, a "Prod C" column, a "Prod D" column, a "Prod E" column, and a "Other" column. Six series are automatically created, one for each product column, and one for the other column. One data point in each series automatically exists per record. We also DataBind the X values (of the data points) to the "SalesRep" column, which is automatically used for the axis labels of the data points. Figure 11 below shows the resulting chart. We assume that the DundasBlue template has been applied to the original chart for appearance purposes.
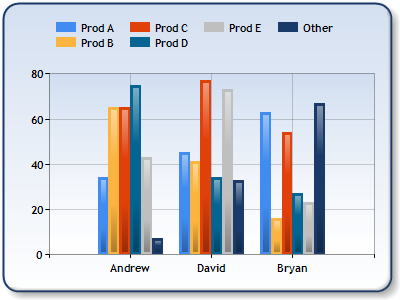
Figure 11: Using the DataBindTable Method for data-binding.
| Visual Basic |  Copy Code Copy Code |
|---|---|
| |
| C# | Copy Code |
|---|---|
| |
The Chart DataBind Method
Data-binding using this method requires the use of properties that include the DataSource property of the Chart, and the ValueMemberX and ValueMembersY properties of the series.
Example
This example demonstrates how to bind the X and Y values of an existing series (named Series1) to the columns "SalesRep", "Prod A", and "Prod B" in the "SALESCOUNT" table in a database called "chartdata.mdb". We use an OleDbDataReader datasource, and assign the reader to the DataSource property. We also explicitly force data-binding (this will also happen automatically by default). Series1 has had its ChartType property set to a bubble chart, which to be plotted correctly, requires two Y values. The first Y value is bound to the "Prod A" column. The second Y value is bound to the "Prod B" column, and is also used for the bubble size. One data point in the series automatically exists per record. We also data-bind the X values to the "SalesRep" column, which is automatically used for the axis labels of the data points. See Figure 3 below for the resulting chart. When the DataSource property is required to perform post-data-bind processing, and the ValueMemberX and ValueMembersY properties are used, you should call the DataBind method of the Chart to force data-binding. However, this is not always required.
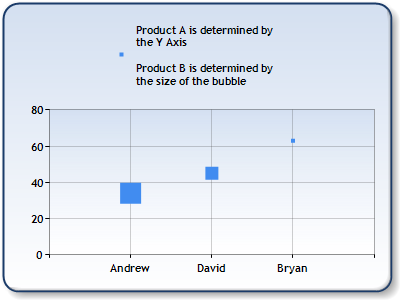
Figure 12: Using the DataSource property and DataBind method for data binding.
| Visual Basic | Copy Code |
|---|---|
| |
| C# | Copy Code |
|---|---|
| |
DataBindY and DataBindXY Methods
The DataBindXY method allows for the binding of X and Y values of a series, while DataBindY binds Y values only. When binding X and Y values using DataBindXY the same or different data sources may be used.
Some data sources support multiple values (e.g. data sources that have columns of data). For example, OleDbDataReader may have access to more than one column of data. If the column to be used is not specified, then the first available column will be used. To use a column other than the first one just specify the column name in the method call.
Note that when specifying the column names to be bound to the Y values a comma can be embedded as part of a column name by specifying a double comma.
Refer to the Summary Table for a listing of this method's Pros and Cons.
 Caution Caution |
|---|
| With Dundas Chart for ASP.NET Professional Edition there are no data points created for missing records. This edition just skips any missing records. However, with Dundas Chart for ASP.NET Enterprise Edition, all missing records will have corresponding data points that have a value of DBNULL. |
Example
This example demonstrates how to take the Y values of all data points in a series named "Series1", and bind them to an array of doubles.
| Visual Basic | Copy Code |
|---|---|
| |
| C# | Copy Code |
|---|---|
| |
Example
This example demonstrates how to take the X and Y values of a series named "Series1", and bind them to columns SalesRep, and Prod B in the "SALESCOUNTS" table in a database called "chartdata.mdb". We use an OleDbDataReader datasource. We assume that the DundasBlue template has been applied to the original chart for appearance purposes.
 |
| Figure 13: Using the DataBindXY method for data binding. |
| Visual Basic | Copy Code |
|---|---|
| |
| C# | Copy Code |
|---|---|
| |
Points.DataBind Method
The DataPointCollection.DataBind method allows for data point properties other than X and Y values to be bound to data columns.
These other properties are bound using the otherFields parameter. The syntax is:
PointProperty=FieldName[{Format}][,PointProperty= FieldName[{Format}]]
A list of these properties includes: AxisLabel, Tooltip, Label, LegendText, LegendTooltip and CustomAttributeName (the name of a custom attribute).
This method does not allow you to specify separate data sources for the X and Y values of a series (for this functionality use the DataBind(X)Y methods described in the section above). Also, the datasource is iterated once per series, which could result in a performance hit if the same datasource is used for multiple series (the method is called on a per series basis). For optimal performance, consider using either the DataBindCrossTab method, or the DataSource property with the DataBind method.
Refer to the Summary Table for a listing of this method's advantages and disadvantages.
Example
This example demonstrates how to take the X and Y values of a series named "Series1" and bind them to columns Name and Sales respectively, in the "Reps" table, in a database called "chartdata.mdb". The Label properties of the resulting data points are also bound to the "Commissions" column (see Figure 4 below). We use an OleDbDataReader datasource. We assume that the DundasBlue template has been applied to the original chart for appearance purposes.
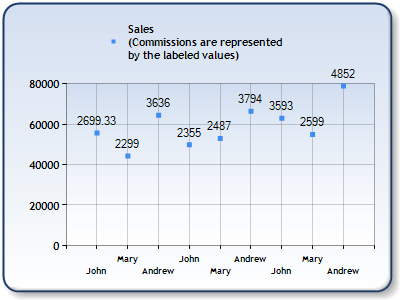
Figure 14: Points.DataBind method - Notice the Label property, which has been bound to a datasource column.
| Visual Basic | Copy Code |
|---|---|
| |
| C# | Copy Code |
|---|---|
| |
The Chart DataBindCrossTab Method
The Chart.DataBindCrossTab is different compared to all other binding methods, in that it allows for the grouping of unique values in a column. Each unique value in the specified grouped column results in the creation of a data series.
Only one pass through the specified datasource is required to perform all binding. In addition extended data point properties other than X and Y values can be bound.
These other properties are bound using the otherFields parameter.
The syntax is:
PointProperty=Field[{Format}] [,PointProperty= Field[{Format}]].
A list of these properties are as follows: AxisLabel, Tooltip, Label, LegendText, LegendTooltip and CustomAttributeName (the name of a custom attribute). For more information on possible formats see the Formatting Types topic in the MSDN library.
Example
In the sample below we have a table that has the sales and commissions of sales people for three years (see Figure 5 below). We group by the "Name" column, thereby creating one data series per sales person. The X values are bound to the "Year" column, the Y values are bound to the "Sales" column, the Label property of the resulting data points (one per record) is bound to the "Commissions" column, and the LegendText property is bound to the "Name" column. We assume that the DundasBlue template has been applied to the original chart for appearance purposes.
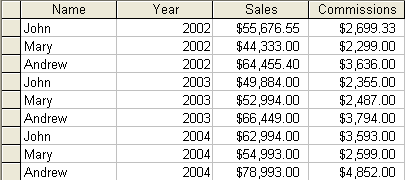
Figure 15: Table used as Data Source.
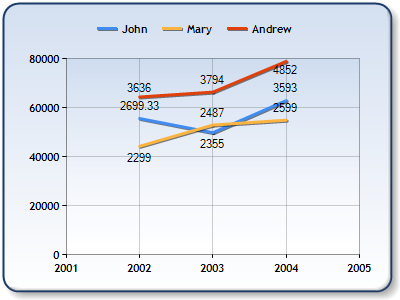
Figure 16: DataBindCrossTab - Notice that data has been grouped by Year.
| Visual Basic | Copy Code |
|---|---|
| |
| C# | Copy Code |
|---|---|
| |
Aligning Data along X Axis using Axis Labels
Two issues arise when multiple, indexed series are plotted, and the X values are being bound to string values:
- We cannot guarantee that data points from different series with the same string X values will be plotted at the same index (i.e. position) along the X axis;
- Only the axis label for the first series' point will be displayed, even though points from other series with the same index have axis labels too.
Example
This example demonstrates how to AlignDataPointsByAxisLabels. Two series are plotted each containing data points. The first series' points have the following labels: "Point 1 - Series 1" and "Point 2". The second series has the axis labels: "Point 1 - Series 2" and "Point 2". In the left-hand image, the first points in the two series are plotted together because they have an index of 0.
The AlignDataPointsByAxisLabels method takes care of this by aligning data points along the X axis using their axis labels. Data points with the same index, but with different axis labels, are plotted at different locations along the X axis. In effect, calling this method allows for the X value, which is a string, to determine where data points are going to be plotted.
Several conditions must be met when calling AlignDataPointsByAxisLabels, otherwise an exception will be thrown:
- The series must be indexed (X values of data points must be zero, or XValueIndexed must be true).
- All AxisLabel properties are non-empty, and are unique for each series.
However, if we call the AlignDataPointsByAxisLabel method the first points in the two series are separated and plotted at different locations along the X axis since they have different axis labels (see Figure 2 below). The second points are not separated since they both have an axis label of "Point 2". We assume a "DundasBlue" template has been added for appearance purposes.
| Visual Basic | Copy Code |
|---|---|
| |
| C# | Copy Code |
|---|---|
| |
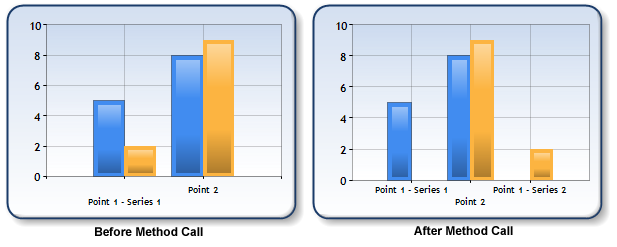
Figure 17: Data points are aligned using their axis values.
By default, points are plotted in the order that they are stored in their series. To specify a sort order, use a definition that has a sortingOrder parameter.
Also by default, all series in the Chart are aligned. To specify that specific series be aligned, use a method definition that takes a Series parameter.