


Overview
The Detrended Price Oscillator attempts to remove trend from prices. By comparing the closing price or any other price with it's moving average, the Detrended Price Oscillator eliminates cycles that are longer than the moving average.
 Note Note |
|---|
| It is highly recommended that you read the Using Financial Formulas topic before reading this topic. The Using Financial Formulas topic provides a detailed explanation on how to use formulas, and also explains the various options available to developers when applying a formula |
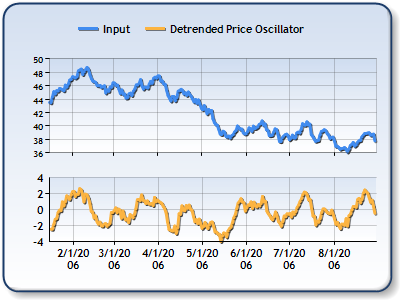 |
| Figure 1: This chart shows the Detrended Price Oscillator with a 10 day period in the lower chart area. The close prices are plotted in the upper chart area. This chart demonstrates that the oscillator doesn't follow the trend for longer than 10 days. |
Applying Detrended Price Oscillator
FormulaFinancial accepts the following types of arguments: a formula name; input value(s); output value(s), and parameter(s) that are specific to the type of formula being applied.
Also, before applying the FormulaFinancial method make sure that all data points have their XValue property set, and the series' XValueIndexed property is set to false. XValueIndexed is false by default, so this property does not have to be set. The following table indicates what sort of FormulaFinancial method arguments to use when calculating a Detrended Price Oscillator, and provides a description of what these parameters mean:
| Parameter |
Value/Description |
Example |
|---|---|---|
| Formula Name: |
DetrendedPriceOscillator
|
FormulaFinancial(FinancialFormula.DetrendedPriceOscillator,"10","Series 1:Y4","Series 3:Y") |
| Input Value: | The value which represents the Close price. By default it is the fourth Y value in the stock chart. |
FormulaFinancial(FinancialFormula.DetrendedPriceOscillator,"10"," Series 1:Y4","Series 3:Y") |
| Output Values: (optional) |
Detrended Price Oscillator. If not specified output is stored in the first input value. |
FormulaFinancial(FinancialFormula.DetrendedPriceOscillator,"10","Series 1:Y4","Series 3:Y") |
|
Parameters: |
Period for Moving Average. |
FormulaFinancial(FinancialFormula.DetrendedPriceOscillator,"10","Series 1:Y4","Series 3:Y") |
A line chart is a good choice when displaying a Detrended Price Oscillator series.
Financial Interpretation: The Detrended price oscillator is used to remove long cycles from a trend. When a price is detrended using the detrended price oscillator, cycles and overbought/oversold levels can be identified more easily. The principal is similar to using longer length technical indicators compared to shorter length technical indicators.
Calculation:
The Detrended Price Oscillator is calculated in the following way:
- The first step is to create a simple moving average ( MA ) using n periods.
- Calculate the Detrended Price Oscillator using the Close price and Moving Average:
-
- DPO = Close – (MA((n/2)+1)) where MA((n/2)+1) means moving average (n/2)+1 days ago.
Example
This example shows how to calculate Detrended price oscillator.
| Visual Basic |  Copy Code Copy Code |
|---|---|
| |
| C# | Copy Code |
|---|---|
| |