


Overview

Ease of Movement deals with the relationship between volume and price change, specifically, it uses volume to indicate how strong a price trend is. Ease of Movement was developed by Richard W Arms.
 Note Note |
|---|
| We recommend that you read Using Financial Formulas before proceeding any further. Using Financial Formulas provides a detailed explanation on how to use formulas, and also explains the various options available to you when applying a formula. |
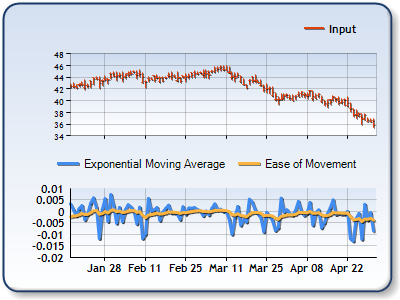 |
| Figure 1: This chart shows Ease of Movement together with its Exponential Moving Average in the lower chart area. The High, Low and Close prices are plotted in the upper chart area as a stock chart. |
Applying Ease of Movement
All formulas are calculated using the FormulaFinancial method, which accepts the following arguments: a formula name; input value(s); output value(s), and parameter(s) that are specific to the type of formula being applied.
Before applying the FormulaFinancial method, make sure that all data points have their XValue property set, and that their series' XValueIndexed property is set to false.
The following table indicates what sort of FormulaFinancial method arguments to use when calculating an Ease of Movement, and also supplies a description of what these parameters mean:
| Parameter |
Value/Description |
Example |
|---|---|---|
| Formula Name: |
EaseOfMovement
|
FormulaFinancial(FinancialFormula.EaseOfMovement ,Series1:Y,Series1:Y2,Series2:Y","Series3:Y") |
| Input Values: | Value #1: The value which represents the High price. By default it is the first Y value in the stock chart.
Value #2: The value which represents the Low price. By default it is the second Y value in the stock chart.
Value #3: The value which represents the Volume. |
FormulaFinancial(FinancialFormula.EaseOfMovement,Series1:Y,Series1:Y2,Series2:Y","Series3:Y") |
| Output Value: (optional) |
The Ease of Movement. If not specified output is stored in the first input value. |
FormulaFinancial(FinancialFormula.EaseOfMovement,Series1:Y,Series1:Y2,Series2:Y"," Series3:Y") |
|
Parameter: |
- |
- |
A line chart is a good choice when displaying an Ease of Movement series.
Financial Interpretation: The Ease of Movement indicator illustrates the relationship between volume and the change in price.
There are:
- low values when there is heavy volume combined with a small price change (means that prices are not moving easily)
- high positive values when prices increase combined with light volume (means that prices are going up easily)
- high negative values when prices decrease combined with light volume (means that prices are going down easily)
Calculation: The Ease of Movement is calculated using following formula:
The Ease of Movement should be accompanied with it's exponential moving average.
Example
This example demonstrates how to calculate Ease of Movement with it's Exponential Moving Average.
| Visual Basic |  Copy Code Copy Code |
|---|---|
| |
| C# | Copy Code |
|---|---|
| |