Overview

Financial markers are used to compare two prices in two different moments. For example, a trend line is a line that is drawn between two important data points (i.e. peaks) on a chart. Also, financial markers are always applied to two data points in a series.
The Chart control supports 6 financial markers including: Fibonacci Arcs, Fibonacci Fans, Fibonacci Retracements, TrendLine, Speed Resistance Lines, and Quadrant Lines (the first three are based on Fibonacci numbers).
Adding and Removing Financial Markers
Adding Financial Markers
To add a financial marker to a chart use the overloaded Add or Insert methods of the Series object's FinancialMarkers property. This property is of type FinancialMarkersCollection class, and stores FinancialMarker objects.
The difference between the Add and Insert definitions is that you have the optional setting of the following:
- Text color and font.
- Line color and width.
- The Y values of the two data points used for a marker (e.g. Y1, Y2, etc.).
Please note that the difference between using the Add or Insert methods is that Add always appends FinancialMarker objects to the series' financial markers collection, while Insert allows for the position of the FinancialMarker objects to be explicitly specified. However, the position of these objects in the collection only determines the order in which the financial markers are drawn.
The marker that is displayed is determined by the markerType parameter, and the data points from a series that are used for the marker are determined by the FirstPointIndex, and SecondPointIndex parameters.
Removing Financial Markers
To remove financial markers call the Clear method of the FinancialMarkers collection property.
Example
This example demonstrates how to clear all of the financial markers specified for a series named "Default" using the Clear method.
| Visual Basic |
 Copy Code Copy Code |
Imports Dundas.Charting.WebControl
  ...

chart1.Series("Default").FinancialMarkers.Clear()
|
| C# |
Copy Code |
using Dundas.Charting.WebControl;
  ...

chart1.Series["Default"].FinancialMarkers.Clear();
|
Working With Fibonacci Concepts
 Caution Caution |
| The code samples used in this article are for purely for display purposes. These code samples have been heavily commented in an effort to clarify the concepts and ideas that the code is trying to convey. Some of these examples will no longer compile due to the commenting present. It is worthy to mention that all of the code samples here were successfully compiled before being commented. If you want to see an example compile, then remove all of the commenting present. |
Fibonacci Arcs
Fibonacci arcs are drawn using the second specified data point as a center, and consist of 4 arcs with radii is equal to 38.2%, 50.0%, 61.8% and 100% of the trend line. The trend line is a line that connects the first and the second specified data point. The last arc (100% trend line size radius) has to intersect the first data point as shown in Figure 1 below.
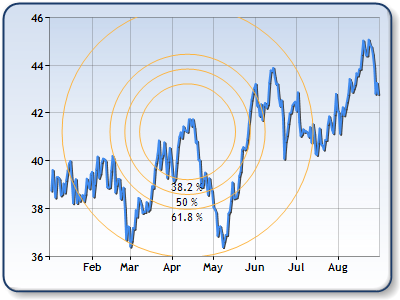
Figure 1: Fibonacci Arcs.
Example
This example demonstrates how to use Fibonacci Arcs for a series in a chart. The Financial Marker produced can be seen in Figure 1 above. We assume the line chart was populated at design-time. Further, we assume that the DundasBlue template has been applied to the original chart for appearance purposes.
| Visual Basic |
Copy Code |
Imports Dundas.Charting.WebControl
  ...

Protected Sub Page_Load(ByVal sender As Object, ByVal e As System.EventArgs) Handles Me.Load
  ' Add Financial Marker.
  Chart1.Series("Price").FinancialMarkers.Add(FinancialMarkerType.FibonacciArcs,
  20, ' First point for marker is 20th data point in the series.
  100, ' Second point for marker is 100th data point in the series.
  0, ' Use first Y value of first point.
  0, ' Use first Y value of second point.
  Color.FromArgb(255, 252, 180, 65), ' Line color.
  1, ' Line Width
  Color.Black, 'Text Color
  New Font("Trebuchet", 8) 'Font Face
  )
End Sub
|
| C# |
Copy Code |
using Dundas.Charting.WebControl;
  ...

protected void Page_Load(object sender, System.EventArgs e)
{
  // Add Financial Marker.
  Chart1.Series("Price").FinancialMarkers.Add(FinancialMarkerType.FibonacciArcs,
  20, // First point for marker is 20th data point in the series.
  100, // Second point for marker is 100th data point in the series.
  0, // Use first Y value of first point.
  0, // Use first Y value of second point.
  Color.FromArgb(255, 252, 180, 65), // Line color.
  1, // Line Width
  Color.Black, // Text Color
  New Font("Trebuchet", 8) // Font Face
  );
}
|
Fibonacci Fans
Fibonacci fans are drawn using a trend line (100% line) from the first data point to second data point. Imagine a vertical line which passes through the second data point. This vertical line is then divided on fibonacci segments 38.2%, 50%, and 61.8% from the first data point's Y position to the second data point's Y position. The Fibonacci fans are lines which connect the first data points with fibonacci segments on the invisible vertical line as shown in Figure 2 below.
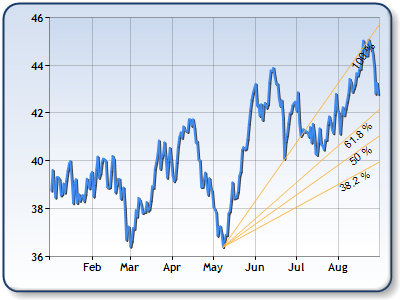
Figure 2: Fibonacci Fans.
Example
This example demonstrates how to use Fibonacci Fans. The Financial Marker produced is shown in Figure 2 above. We assume the line chart was populated at design-time. Further, we assume that the DundasBlue template has been applied to the original chart for appearance purposes.
| Visual Basic |
Copy Code |
Imports Dundas.Charting.WebControl
  ...

Protected Sub Page_Load(ByVal sender As Object, ByVal e As System.EventArgs) Handles Me.Load

    Dim maxindex As Integer =  0
    Dim minindex As Integer =  0

    ' Find first data point with the maximum X value.
    Dim maxDataPoint As DataPoint =  chart1.Series(0).Points.FindMaxValue("Y")

    ' Find the first data point with the minimum second Y value.
    Dim minDataPoint As DataPoint =  chart1.Series(0).Points.FindMinValue("Y")

    Dim i As Integer
    For  i = 0 To  chart1.Series(0).Points.Count- 1  Step  i + 1

    If maxDataPoInteger.Equals(chart1.Series(0).Points(i)) Then
        maxindex = i
    End If

    If minDataPoInteger.Equals(chart1.Series(0).Points(i)) Then
        minindex = i
    End If

    Next

        ' Add Financial Marker.
        chart1.Series("Price").FinancialMarkers.Add(
        FinancialMarkerType.FibonacciFans,' Financial Marker type.
        minindex, ' First Point has the smallest y value in the series.
        maxindex , ' Second point has the largest y value in the series.
        0, ' Use first Y value of first point.
        0, ' Use first Y value of second point.
        Color.FromArgb(255,252,180,65), ' Marker line color.
        1, ' Marker line width.
        Color.Black, ' Font color.
        New Font("Trebuchet", 8) 'Font Face
        )


End Sub
|
| C# |
Copy Code |
using Dundas.Charting.WebControl;
  ...

protected void Page_Load(object sender, EventArgs e)
{
        int maxindex = 0;
        int minindex = 0;

        // Find first data point with the maximum X value.
        DataPoint maxDataPoint = chart1.Series[0].Points.FindMaxValue("Y");

        // Find the first data point with the minimum second Y value.
        DataPoint minDataPoint = chart1.Series[0].Points.FindMinValue("Y");

        for (int i = 0; i < chart1.Series[0].Points.Count; i++)
        {
                if(maxDataPoint.Equals(chart1.Series[0].Points[i]))
                {
                        maxIndex = i;
                }
                if(minDataPoint.Equals(chart1.Series[0].Points[i]))
                       {
                minIndex = i;
                       }
        }

        // Add Financial Marker.
        chart1.Series["Price"].FinancialMarkers.Add(
                FinancialMarkerType.FibonacciFans,// Financial Marker type.
                minindex, // First Point has the smallest y value in the series.
                maxindex , // Second point has the largest y value in the series.
                0, // Use first Y value of first point.
                0, // Use first Y value of second point.
                Color.FromArgb(255,252,180,65), // Marker line color.
                1, // Marker line width.
                        Color.Black, // Font color.
                new Font("Trebuchet", 8) // Font face.
                        );

}
|
Fibonacci Retracements
Fibonacci Retracements are drawn using a trend line between the first and the second specified data point. A set of nine horizontal lines is drawn intersecting the trend line at Fibonacci levels: 0.0%, 23.6%, 38.2%, 50%, 61.8%, 100%, 161.8%, 261.8%, and 423.6% (see the figure below).
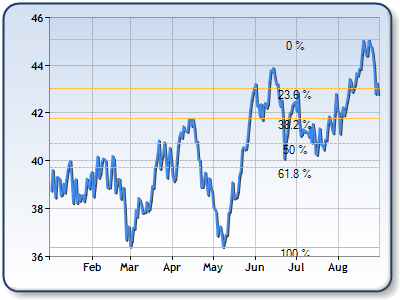
Figure 3: Fibonacci Retracements.
Example
This example demonstrates how to use Fibonacci Retracements. The Financial Marker produced is shown in Figure 3 above. We assume the line chart was populated at design-time. Further, we assume that the DundasBlue template has been applied to the original chart for appearance purposes.
| Visual Basic |
Copy Code |
Imports Dundas.Charting.WebControl
  ...

Protected Sub Page_Load(ByVal sender As Object, ByVal e As System.EventArgs) Handles Me.Load

    Dim maxindex As Integer =  0
    Dim minindex As Integer =  0

    ' Find first data point with the maximum X value.
    Dim maxDataPoint As DataPoint =  chart1.Series(0).Points.FindMaxValue("Y")

    ' Find the first data point with the minimum second Y value.
    Dim minDataPoint As DataPoint =  chart1.Series(0).Points.FindMinValue("Y")

    Dim i As Integer
    For  i = 0 To  chart1.Series(0).Points.Count- 1  Step  i + 1
        If maxDataPoInteger.Equals(chart1.Series(0).Points(i)) Then
            maxindex = i
        End If
        If minDataPoInteger.Equals(chart1.Series(0).Points(i)) Then
            minindex = i
        End If
    Next

    ' Add Financial Marker.
    chart2.Series("Price").FinancialMarkers.Add(
      FinancialMarkerType.FibonacciRetracements,' Financial Marker type.
      minindex, ' First Point has the smallest y value in the series.
      maxindex, ' Second point has the largest y value in the series.
      0, ' Use first Y value of first point.
      0, ' Use first Y value of second point.
      Color.FromArgb(255, 252, 180, 65), ' Marker line color.
      1, ' Marker line width.
      Color.Black, ' Font color.
      new Font("Trebuchet", 8) // Font face.
      )
|
| C# |
Copy Code |
using Dundas.Charting.WebControl;
  ...

protected void Page_Load(object sender, System.EventArgs e)
{

        int maxindex = 0;
        int minindex = 0;

    // Find first data point with the maximum X value.
    DataPoint maxDataPoint = chart1.Series[0].Points.FindMaxValue("Y");

    // Find the first data point with the minimum second Y value.
    DataPoint minDataPoint = chart1.Series[0].Points.FindMinValue("Y");

    for (int i = 0; i < chart1.Series[0].Points.Count; i++)
    {
        if(maxDataPoint.Equals(chart1.Series[0].Points[i]))
        {
            maxIndex = i;
        }
        if(minDataPoint.Equals(chart1.Series[0].Points[i]))
        {
            minIndex = i;
        }
    }

    // Add Financial Marker.
    chart1.Series["Price"].FinancialMarkers.Add(
      FinancialMarkerType.FibonacciRetracements,// Financial Marker type.
      minindex, // First Point has the smallest y value in the series.
      maxindex, // Second point has the largest y value in the series.
      0, // Use first Y value of first point.
      0, // Use first Y value of second point.
      Color.FromArgb(255, 252, 180, 65), // Marker line color.
      1, // Marker line width.
      Color.Black, // Font color.
      new Font("Trebuchet", 8) // Font face.
      );
}
|
 Note Note |
| Please note that all nine horizontal lines may not be shown because of the scale. |
Speed Resistance Lines
Speed Resistance Lines are drawn using a trend line (100% line) from the first data point to a second data point. Imagine a vertical line which passes through the second data point. This vertical line is divided into segments with values of 33.3% or (1/3), and 66.6% (2/3) from the first data point's Y position, to the second data point's Y position. Speed Resistance Lines are the lines that connect the first group of data points with Speed Resistance segments on the invisible vertical line as shown in Figure 4 below.
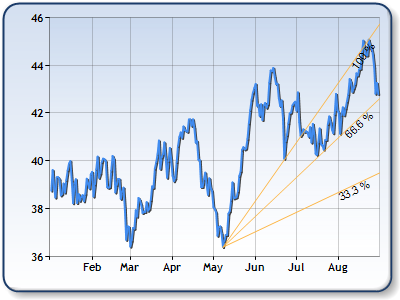
Figure 4: Speed Resistance Lines.
Example
This example demonstrates how to use Speed Resistance Lines. The Financial Marker produced is shown in Figure 4 above. We assume the line chart was populated at design-time. Further, we assume that the DundasBlue template has been applied to the original chart for appearance purposes.
| Visual Basic |
Copy Code |
Imports Dundas.Charting.WebControl
  ...

Protected Sub Page_Load(ByVal sender As Object, ByVal e As System.EventArgs) Handles Me.Load

    Dim maxindex As Integer =  0
    Dim minindex As Integer =  0

    ' Find first data point with the maximum X value.
    Dim maxDataPoint As DataPoint =  chart1.Series(0).Points.FindMaxValue("Y")

    ' Find the first data point with the minimum second Y value.
    Dim minDataPoint As DataPoint =  chart1.Series(0).Points.FindMinValue("Y")

    Dim i As Integer
    For  i = 0 To  chart1.Series(0).Points.Count- 1  Step  i + 1
        If maxDataPoInteger.Equals(chart1.Series(0).Points(i)) Then
            maxindex = i
        End If
        If minDataPoInteger.Equals(chart1.Series(0).Points(i)) Then
            minindex = i
        End If
    Next

    ' Add Financial Marker.
    chart4.Series("Price").FinancialMarkers.Add(
      FinancialMarkerType.SpeedResistanceLines, ' Financial Marker type.
      minindex, ' First Point has the smallest y value in the series.
      maxindex, ' Second point has the largest y value in the series.
      0, ' Use first Y value of first point.
      0, ' Use first Y value of second point.
      Color.FromArgb(255, 252, 180, 65), ' Marker line color.
      1, ' Marker line width.
      Color.Black, ' Font color.
      new Font("Trebuchet", 8) // Font face.
    )
|
| C# |
Copy Code |
using Dundas.Charting.WebControl;
  ...

protected void Page_Load(object sender, System.EventArgs e)
{
    int maxindex = 0;
    int minindex = 0;

    // Find first data point with the maximum X value.
    DataPoint maxDataPoint = chart1.Series[0].Points.FindMaxValue("Y");

    // Find the first data point with the minimum second Y value.
    DataPoint minDataPoint = chart1.Series[0].Points.FindMinValue("Y");

    for (int i = 0; i < chart1.Series[0].Points.Count; i++)
    {
        if(maxDataPoint.Equals(chart1.Series[0].Points[i]))
        {
            maxindex = i;
        }
        if(minDataPoint.Equals(chart1.Series[0].Points[i]))
        {
            minindex = i;
        }
    }

    // Add Financial Marker.
    chart1.Series["Price"].FinancialMarkers.Add(
      FinancialMarkerType.SpeedResistanceLines, // Financial Marker type.
      minindex, // First Point has the smallest y value in the series.
      maxindex, // Second point has the largest y value in the series.
      0, // Use first Y value of first point.
      0, // Use first Y value of second point.
      Color.FromArgb(255, 252, 180, 65), // Marker line color.
      1, // Marker line width.
      Color.Black, // Font color.
      new Font("Trebuchet", 8) // Font face.
      );
}
|
Trend Line
A trend line is a straight line that connects two or more price points and act as a line of support or resistance. Technical analysis basically is built on the assumption that prices trend.
An Up trend line is a trend line that has a positive slope and moves in an upward direction. It is formed by connecting two or more lows in prices. In order to get a positive slope, the second connecting low must be higher than the first. A Down trend line is a trend line that has a negative slope and moves in a downward direction. It is formed by connecting two or more highs. In order to get a negative slope, the second high must be lower than the first. See the image below for an example of a Trend Line.
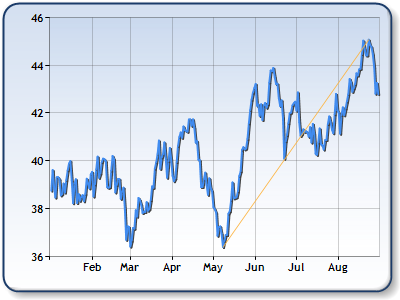
Figure 5: TrendLine.
Example
This example demonstrates how to use Trend Lines. The Financial Marker produced is shown in Figure 5 above. We assume the line chart was populated at design-time. Further, we assume that the DundasBlue template has been applied to the original chart for appearance purposes.
| Visual Basic |
Copy Code |
Imports Dundas.Charting.WebControl
  ...

Protected Sub Page_Load(ByVal sender As Object, ByVal e As System.EventArgs) Handles Me.Load

    Dim maxindex As Integer =  0
    Dim minindex As Integer =  0

    ' Find first data point with the maximum X value.
    Dim maxDataPoint As DataPoint =  chart1.Series(0).Points.FindMaxValue("Y")

    ' Find the first data point with the minimum second Y value.
    Dim minDataPoint As DataPoint =  chart1.Series(0).Points.FindMinValue("Y")

    Dim i As Integer
    For  i = 0 To  chart1.Series(0).Points.Count- 1  Step  i + 1
        If maxDataPoInteger.Equals(chart1.Series(0).Points(i)) Then
            maxindex = i
        End If
        If minDataPoInteger.Equals(chart1.Series(0).Points(i)) Then
            minindex = i
        End If
    Next

    ' Add Financial Marker.
    chart1.Series("Price").FinancialMarkers.Add(
      FinancialMarkerType.TrendLine, ' Financial Marker type.
      minindex, ' First Point has the smallest y value in the series.
      maxindex, ' Second point has the largest y value in the series.
      0, ' Use first Y value of first point.
      0, ' Use first Y value of second point.
      Color.FromArgb(255, 252, 180, 65), ' Marker line color.
      1, ' Marker line width.
      Color.Black, ' Font color.
      new Font("Trebuchet", 8) // Font face.
    )
End Sub
|
| C# |
Copy Code |
using Dundas.Charting.WebControl;
  ...

protected void Page_Load(object sender, System.EventArgs e)
{
    int maxindex = 0;
    int minindex = 0;

    // Find first data point with the maximum X value.
    DataPoint maxDataPoint = chart1.Series[0].Points.FindMaxValue("Y");

    // Find the first data point with the minimum second Y value.
    DataPoint minDataPoint = chart1.Series[0].Points.FindMinValue("Y");

    for (int i = 0; i < chart1.Series[0].Points.Count; i++)
    {
        if(maxDataPoint.Equals(chart1.Series[0].Points[i]))
        {
            maxindex = i;
        }
        if(minDataPoint.Equals(chart1.Series[0].Points[i]))
        {
            minindex = i;
        }
    }

    // Add Financial Marker.
    chart1.Series["Price"].FinancialMarkers.Add(
      FinancialMarkerType.TrendLine, // Financial Marker type.
      minindex, // First Point has the smallest y value in the series.
      maxindex, // Second point has the largest y value in the series.
      0, // Use first Y value of first point.
      0, // Use first Y value of second point.
      Color.FromArgb(255, 252, 180, 65), // Marker line color.
      1, // Marker line width.
      Color.Black, // Font color.
      new Font("Trebuchet", 8) // Font face.
    );
}
|
Quadrant Lines
Quadrant Lines are drawn using a trend line between the first and the second data points. A set of nine horizontal lines is drawn intersecting the trend line at levels: 0.0%, 25%, 50%, 75% and 100%.
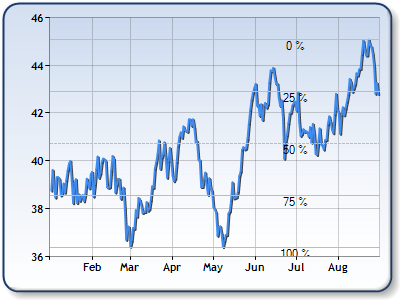
Figure 6: QuadrantLines.
Example
This example demonstrates how to use Quadrant Lines. The Financial Marker produced is shown in Figure 6 above. We assume the line chart was populated at design-time. Further, we assume that the DundasBlue template has been applied to the original chart for appearance purposes.
| Visual Basic |
Copy Code |
Imports Dundas.Charting.WebControl
  ...

Protected Sub Page_Load(ByVal sender As Object, ByVal e As System.EventArgs) Handles Me.Load

        Dim maxindex As Integer =  0
    Dim minindex As Integer =  0

    ' Find first data point with the maximum X value.
    Dim maxDataPoint As DataPoint =  chart1.Series(0).Points.FindMaxValue("Y")

    ' Find the first data point with the minimum second Y value.
    Dim minDataPoint As DataPoint =  chart1.Series(0).Points.FindMinValue("Y")

    Dim i As Integer
    For  i = 0 To  chart1.Series(0).Points.Count- 1  Step  i + 1
        If maxDataPoInteger.Equals(chart1.Series(0).Points(i)) Then
            maxindex = i
        End If
        If minDataPoInteger.Equals(chart1.Series(0).Points(i)) Then
            minindex = i
        End If
    Next


    ' Add Financial Marker.
    chart6.Series("Price").FinancialMarkers.Add(
    FinancialMarkerType.QuadrantLines, ' Financial Marker type.
    minindex, ' First Point has the smallest y value in the series.
    maxindex, ' Second point has the largest y value in the series.
    0, ' Use first Y value of first point.
    0, ' Use first Y value of second point.
    Color.FromArgb(255, 252, 180, 65), ' Marker line color.
    1, ' Marker line width.
    Color.Black, ' Font color.
    new Font("Trebuchet", 8) // Font face.
    )
}
|
| C# |
Copy Code |
using Dundas.Charting.WebControl;
  ...

protected void Page_Load(object sender, System.EventArgs e)
{
    int maxindex = 0;
    int minindex = 0;

    // Find first data point with the maximum X value.
    DataPoint maxDataPoint = chart1.Series[0].Points.FindMaxValue("Y");

    // Find the first data point with the minimum second Y value.
    DataPoint minDataPoint = chart1.Series[0].Points.FindMinValue("Y");

    for (int i = 0; i < chart1.Series[0].Points.Count; i++)
    {
        if(maxDataPoint.Equals(chart1.Series[0].Points[i]))
        {
            maxindex = i;
        }
        if(minDataPoint.Equals(chart1.Series[0].Points[i]))
        {
            minindex = i;
        }
    }

    // Add Financial Marker.
    chart6.Series["Price"].FinancialMarkers.Add(
    FinancialMarkerType.QuadrantLines, // Financial Marker type.
    minindex, // First Point has the smallest y value in the series.
    maxindex, // Second point has the largest y value in the series.
    0, // Use first Y value of first point.
    0, // Use first Y value of second point.
    Color.FromArgb(255, 252, 180, 65), // Marker line color.
    1, // Marker line width.
    Color.Black, // Font color.
    new Font("Trebuchet", 8) // Font face.
    );
}
|
Fibonacci Numbers
Fibonacci numbers are a sequence of numbers in which each successive number is the sum of the two previous numbers: 1, 1, 2, 3, 5, 8, 13, 21, 34, 55, 89, 144, 610, etc. These numbers possess an intriguing number of interrelationships, such as the fact that any given number is approximately 1.618 times the preceding number and any given number is approximately 0.618 times the following number. A second property is that as you go out in the sequence, the ratios of neighboring terms approach a fixed ratio of about 1.618:
Fibonacci numbers seem to occur in nature, but they are also used in technical analysis to predict the behavior of the stock market. The theory here is that the collective "investor mind" is inevitably governed by nature, therefore it follows that investments made by the collective "investor mind", and which are growing with compound interest over the long run, can be predicted with a reasonable amount of accuracy using Fibonacci numbers.
 See Also


