


Overview

Statistics is the study of how to acquire meaningful information by analyzing data (e.g. a list of numbers). Dundas Chart for ASP.NET provides a complete set of statistical analysis functions, which are implemented using the Statistics class (exposed as the Statistics property of the DataManipulator class).
This Statistics class can be organized into 4 general groups:
- Statistical Tests.
- Statistical Distributions.
- Basic Statistical Functions.
- Utility functions.
It is important to note that all statistical methods that use one or more Series for their input data cannot use indexed data points.
Since these statistical methods cannot use indexed data points, therefore you must:
- Set the XValue property of all data points explicitly.
- Be certain that each series' XValueIndexed property is false.
Statistical Tests
Statistical tests are used for Hypothesis testing. There are 6 different tests: ANOVA, F-Test, Z-Test, T-Tests (Equal Variance, Unequal Variance and Paired). All tests use series and various parameters for input, while the output value for each test is a test result class. These classes have read-only properties, and store the results from the tests.
Unlike the other tests that must have exactly two input series, the Anova test can have more then two input series.
Example
The following sample performs an Anova test for three series of data.
| Visual Basic |  Copy Code Copy Code |
|---|---|
| |
| C# | Copy Code |
|---|---|
| |
Example
The following sample performs a T Test assuming equal variances. The first parameter is the Hypothesis Mean Difference, and in this case the hypothesis is that the first group has a mean which is less the second group mean by 0.6. The second parameter is the probability that the hypothesis test is rejected.
| Visual Basic | Copy Code |
|---|---|
| |
| C# | Copy Code |
|---|---|
| |
Distribution Formulas
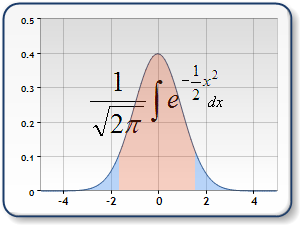
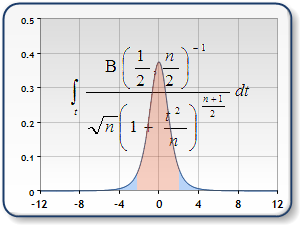
Dundas chart supports 3 Distributions: Normal Distribution, T-Distribution (or Students Distribution), and F-Distribution.
  |
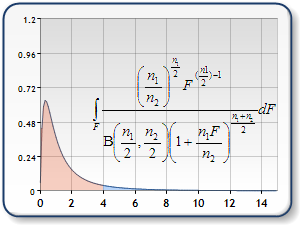 | |
| Figure 1: Graph of Standard Normal Distribution (left), T distribution (middle), and F Distribution (right). | ||
The Distribution functions always have one double value for input, and return the probability for that distribution. The Inverse Distribution functions use probability as an input value, along with one, or two degrees of freedom.
Example
This example demonstrates how to calculate the inverse F distribution.
| Visual Basic | Copy Code |
|---|---|
| |
| C# | Copy Code |
|---|---|
| |
Basic Statistical Formulas
The basic statistical functions are: Mean, Median, Variance, Correlation and Covariance. These functions always return a double value, and use one or two series for input.
Example
This example demonstrates how to calculate the Covariance.
| Visual Basic | Copy Code |
|---|---|
| |
| C# | Copy Code |
|---|---|
| |
Utility Functions
There are two utility functions: the Gamma and Beta functions, which are used in statistics to calculate distribution values. These functions always return a double value and use one or two double values for input.
Example
This example demonstrates how to calculate the Beta function.
| Visual Basic | Copy Code |
|---|---|
| |
| C# | Copy Code |
|---|---|
| |
 See Also
Formulas
Using Financial Formulas
Statistical Formulas
Statistical Formula Listing