


Overview
A client-side image map is a standard HTML element that is used to define interactive areas within an image. Each image map contains a collection of map areas, and each map area defines an interactive region that can be used for many purposes including:
-
Navigating to different pages, like for example in a drilldown procedure.
-
Handling client-side map area events like OnClick, OnMouseEnter, OnMouseLeave, and others.
-
Displaying tooltips.
Several chart elements can have associated map areas, these being: data points, series, legend items, and strip lines. In addition to this, custom map areas that have user-defined coordinates can also be created by using the MapAreas collection property of the root Chart object.
How to Create a Client-Side Image Map
Image map areas will be automatically created if the MapEnabled property of the root Chart object is set to True and:
-
one of the chart elements (a data points, series, legend item or strip line) has a non-empty ToolTip, Href or MapAreaAttributes property. In this case the position of the image map is determined by the shape of the chart element. Setting the LegendMapAreaAttributes, LegendHref or LegendToolTip property for a series or data point will also result in an image map being generated.
-
the MapAreas collection property of the chart is not empty, and contains one or more custom MapArea objects. In this case the dimensions of the image map are set by the developer.
When using this technique the chart image map will only be rendered when the chart's RenderType property is set to "ImageTag". However, a chart image map can be displayed when using a rendering type of binary streaming (results in fast chart rendering), but a different technique must be used for the image map creation. Refer to the Client-Side Mapping and Binary Streaming topic for further details.
By default the MapEnabled property of the chart is set to true. To disable an image map: do not set the ToolTip, Href and MapAreaAttributes properties of the relevant chart element; or set the MapEnabled property to false.
Rectangular areas are created for the LegendItem and StripLine classes. The shapes of data point and series map areas depends on the chart type being displayed, while for custom image maps the shape is determined by the MapArea.Shape property.
Map Area Properties
Map area objects including DataPoint, Series, LegendItem, StripLine, and MapArea have the following properties in common:
- ToolTip. A string shown when the user's cursor is over the map area. Line breaks for the tooltip may be used (a character sequence at design-time, and the relevant .NET language's line break/carriage return expression at run-time; for example, vbCrLf for VB.NET).
- Href. A link to another page that is loaded when the end-user clicks on the map area.
- MapAreaAttributes. Other map area attributes, such as "target", etc. It can also be used to handle client-side map area events using JavaScript. Note that this string will be added at the end of the AREA tag.
Example
This example demonstrates how to enable series tooltips and drilldown capabilities, as well as how to set map area target to _blank so that a new browser window will be opened when the end-user clicks on the series.
| Visual Basic |  Copy Code Copy Code |
|---|---|
| |
| C# | Copy Code |
|---|---|
| |
Example
This example demonstrates how to use client-side JavaScript to display a message when the end-user clicks on a data point.
| Visual Basic | Copy Code |
|---|---|
| |
| C# | Copy Code |
|---|---|
| |
Using Keywords in ToolTip, Href and MapAreaAttributes Properties
Special keywords, which are case sensitive, can be inserted in the ToolTip, Href, or MapAreaAttributes string properties of DataPoint, Series, LegendItem, and StripLine objects (not applicable to custom map areas). These keywords will then be replaced with actual element data (see table below). The following are several scenarios where these keywords would be helpful:
- Passing querystring parameters in a URL for drilldown (e.g. series name and point index that was clicked on).
- Showing point values or percentages in data point tool tips.
- Showing a total value in the legend tooltips.
When setting tooltips, line breaks may also be used (a character sequence at design-time, and the relevant .NET language's line break/carriage return expression at run-time e.g. vbCrLf for Visual Basic.NET). For example, to display tooltips for all data points in a series, where the tooltip displays the first Y value on the first tooltip line, and the second Y value on the second tooltip line, use the following expression at run-time (VB):
Chart1.Series(1).ToolTip = "Y1= #VALY" & vbCrLf &"Y2= #VALY2"
The following is a listing of these keywords and the values that replace them:
|
Keyword |
Replaced by |
|---|---|
|
#VALX |
X value of the data point. |
|
#VAL, #VALY, |
Y values of the data point. |
|
#SER |
Series name. |
|
#LABEL |
Data point label. |
|
#INDEX |
Data point index. |
|
#PERCENT |
Percentage of a data point's Y value |
|
#TOTAL |
Total of all Y values in the series. |
|
#LEGENDTEXT |
Legend text. |
Optional formatting may be applied to the #TOTAL, #PERCENT and all #VAL... keywords, and is implemented by following the keyword with a format specifier enclosed in braces. For example, to display the first Y value as a tooltip, and format it as a percentage, set the ToolTip property to: "#VALY{P}".
Example
This example demonstrates how to show data point tooltips with their percentage value. It also demonstrates how to provide a drilldown URL with the series name, and point index as querystring parameters.
| Visual Basic | Copy Code |
|---|---|
| |
| C# | Copy Code |
|---|---|
| |
Example
This example demonstrates how to show data point tooltips with High-Low-Open-Close values as shown in Figure 1 below. A stock chart type is used, which requires 4 y values (High, Low, Open Close). We assume, that a series has had five points added at design-time. Further, we assume that the DundasBlue template has been applied to the original chart for appearance purposes.
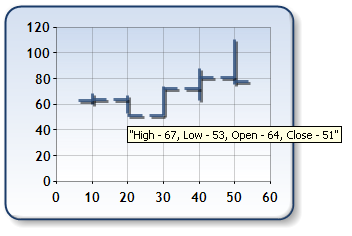
Figure 1: A chart with tooltips used to show values.
| Visual Basic | Copy Code |
|---|---|
| |
| C# | Copy Code |
|---|---|
| |
Creating User-Defined Map Areas
The MapAreas collection of the chart can be used to add user defined map areas , and provide interactive abilities like drilldown, tooltips and client-side events for any user-defined region within the chart. An image map will be automatically generated if the MapAreas collection is not empty and the MapEnabled property of the chart is set to true.
Each MapArea object in this collection defines an interactive region using the Shape and Coordinates properties. The number of coordinates specified by the Coordinates array property depends on the shape of the map area:
- Circle. Three coordinates must be provided: "x1,y1,r". x1,y2 are the coordinates of the center of the circle and r is the radius of the circle.
- Rectangle. Four coordinates must be provided: "x1,y1,x2,y2". x1,y1 are the coordinates of the upper-left corner of the rectangle and x2,y2 are the coordinates of the lower-right corner of the rectangle.
- Polygon. Two or more x and y pairs may be provided: "x1,y1,x2,y2...xn,yn". Each x,y pair represents the coordinates of one vertex of the polygon.
When the map area's shape and coordinates are defined the ToolTip, Href or MapAreaAttributes properties can then be set to provide the required interaction for the area.
 Note Note |
|---|
| If two map regions are overlapped the first map area in the collection will have priority. |
Example
This example demonstrates how to add a custom map area for the entire chart image.
| Visual Basic | Copy Code |
|---|---|
| |
| C# | Copy Code |
|---|---|
| |