


Overview

Median prices are mid-point values of daily prices, and therefore can be used as a filter to help identify trends. They are also used as a daily average price which is very useful if you want a more simple "view" of prices.
 Note Note |
|---|
| We recommend that you read Using Financial Formulas before proceeding any further. Using Financial Formulas provides a detailed explanation on how to use formulas, and also explains the various options available to you when applying a formula. |
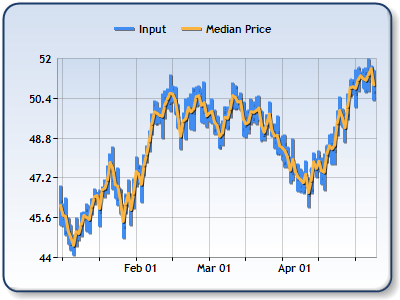 |
| Figure 1: The Median Price, which is the daily average between Hi and Low prices. |
Applying a Median Price
All formulas are calculated using the FormulaFinancial method, which accepts the following types of arguments: a formula name; input value(s); output value(s), and parameter(s) that are specific to the type of formula being applied.
Also, before applying the FormulaFinancial method, make sure that all data points have their XValue property set, and that their series' XValueIndexedproperty has been set to false.
The following table indicates what sort of FormulaFinancial method arguments to use when calculating a Median Price, and also supplies a description of what these parameters mean:
| Parameter |
Value/Description |
Example |
|---|---|---|
| Formula Name: |
MedianPrice
|
FormulaFinancial(FinancialFormula.MedianPrice,"Series1:Y,Series1:Y2","Series2:Y") |
| Input Values: |
Value #1: A value that represents the High price. In the Dundas chart by default it is the first Y value in the stock chart. |
FormulaFinancial(FinancialFormula.MedianPrice,"Series1:Y,Series1:Y2","Series2:Y") |
| Output Value: (optional) |
The Median Price. If not specified output is stored in the first input value. |
FormulaFinancial(FinancialFormula.MedianPrice,"Series1:Y,Series1:Y2"," Series2:Y") |
|
Parameter: |
- |
- |
A line chart is a good choice when displaying a median price series.
Financial Interpretation: This indicator is good solution if we want to replace a stock chart with a single line chart. The Median Price is merely the daily average of Hi and Low prices.
Calculation: The Median price is calculated using the following formula:
![]()
Median price is the daily average of high and low prices.
Example
This example demonstrates how to calculate the Median price.
| Visual Basic |  Copy Code Copy Code |
|---|---|
| |
| C# | Copy Code |
|---|---|
| |