


Overview

The money flow indicator compares upward changes and downward changes of volume-weighted typical prices. This indicator is similar to the relative strength index, the difference being the volume-weighted prices. This indicator can be used to identify market tops and bottoms.
 Note Note |
|---|
| We recommend that you read Using Financial Formulas before proceeding any further. Using Financial Formulas provides a detailed explanation on how to use formulas, and also explains the various options available to you when applying a formula. |
 |
|
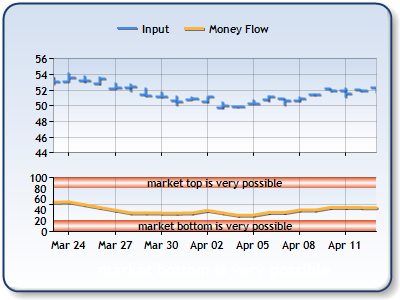
Figure 1: The upper chart area displays a stock chart with Hi, Low and Close prices. The Money flow indicator is plotted in the lower chart area. |
Applying a Money Flow
All formulas are calculated using the FormulaFinancial method, which accepts the following arguments: a formula name; input value(s); output value(s), and parameter(s) that are specific to the type of formula being applied.
Before applying the FormulaFinancial method, make sure that all data points have their XValue property set, and that their series' XValueIndexed property is set to false.
The following table indicates what sort of FormulaFinancial method arguments to use when calculating a Money Flow, and also supplies a description of what these parameters mean:
| Parameter |
Value/Description |
Example |
|---|---|---|
| Formula Name: |
MoneyFlow
|
FormulaFinancial(FinancialFormula.MoneyFlow,"20", _ "Series1:Y,Series1:Y2,Series1:Y4,Series2:Y","Series3:Y") |
| Input Values: | Value #1: Value which represents the High price. By default this is the first Y value in the stock chart. Value #2: Value which represents the Low price. By default this is the second Y value in the stock chart. Value #3: Value which represents the Close price. By default this is the fourth Y value in the stock chart. |
FormulaFinancial("MoneyFlow","20", _ "Series1:Y,Series1:Y2,Series1:Y4,Series2:Y","Series3:Y") |
| Output Value: (optional) |
The Money Flow. If not specified output is stored in the first input value. |
FormulaFinancial(FinancialFormula.MoneyFlow,"20", _ "Series1:Y,Series1:Y2,Series1:Y4,Series2:Y","Series3:Y") |
|
Parameter: |
Period used to calculate Money Flow. |
FormulaFinancial(FinancialFormula.MoneyFlow,"20", _ "Series1:Y,Series1:Y2,Series1:Y4,Series2:Y","Series3:Y") |
A line chart is a good choice when displaying a money flow series.
Financial Interpretation: This indicator is used to show trend weakness, and compares values for days when the price is going up and values for the days when price is going down. This indicator can also show possible reversal points.
If the money flow is above 80 the market top is very possible. When the money flow is below 20 the market bottom is very possible.
Calculation: The first step to calculate the Money Flow index is to find the Typical price.
![]()
![]()
If yesterday's Typical Price is less than today's Typical Price there is a Positive Money Flow. If today's price is less than yesterday's price it is Negative Money Flow.
The next step is to calculate the sums of all positive and all negative MF values.
Money ratio is then calculated:
Money Ratio = Positive MF / Negative MF
The last step is to find the Money Flow:
MoneyFlow = 100 - 100 / ( 1 + MoneyRatio )
Example
This example demonstrates how to calculate money flow.
| Visual Basic |  Copy Code Copy Code |
|---|---|
| |
| C# | Copy Code |
|---|---|
| |