


Overview

Point and Figure charts differ from traditional price charts in that they completely disregard the passage of time, and only display changes in prices. Rather than having price on the y-axis, and time on the x-axis, Point and Figure charts display price changes on both axes. This is similar to the Kagi, Renko, and Three Line Break charts.
The Point and Figure chart displays the underlying supply and demand as reflected in the price values. A column of Xs shows that demand is exceeding supply, which is known as a rally, a column of Os shows that supply is exceeding demand, which is known as a decline, and a series of short columns shows that supply and demand are relatively equal, which of course, represents a market equilibrium.
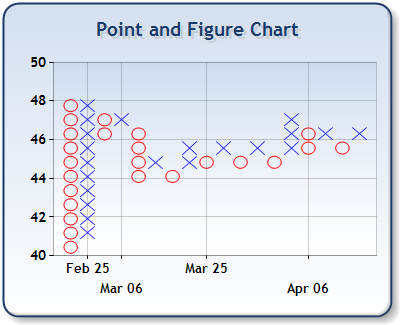
Figure 1: A Point and Figure chart.
Working with Point and Figure Charts
The following should be taken into account when working with this type of chart:
- The X values of data points are automatically indexed. For more information see the topic on Indexing Data Point X Values.
- There is a formula applied to the original data before it gets plotted. This formula changes the number of points, as well as their X/Y values.
- Due to the data being recalculated, we do not recommend setting the minimum, or maximum values for the X axis. This is because it cannot be determined how many data points will actually be plotted. However, if the axis' Maximum, or Minimum is set, then the Maximum, and Minimum properties will use data point index values.
- Data point anchoring, used for annotations, is not supported with this type of chart.
 Note Note |
|---|
|
The Point and Figure Chart Type cannot be combined with any other Chart Types. |
Custom Attributes
The Point and Figure chart requires 2 Y values, one for the high price value, and one for the low price value. This chart possesses many custom attributes including UsedYValueHigh, UsedYValueLow, BoxSize, CurrentBoxSize, ReversalAmount, PriceUpColor, and ProportionalSymbols attribute. Each of these attributes is discussed immediately following.
The UsedYValueHigh Attribute
The UsedYValueHigh attribute, for a series with multiple YValues, defines a zero based index value for the Y value to use. If this value is not specified, then the value for the UsedYValueHigh attribute will default to the value of the first YValue present at index zero.
Example
This example demonstrates how to use the UsedYValueHigh custom attribute.
| Visual Basic |  Copy Code Copy Code |
|---|---|
|
|
| C# | Copy Code |
|---|---|
|
|
The UsedYValueLow Attribute
The UsedYValueLow attribute, for a Series with multiple YValues, defines a zero based index value for the Y value to use. If this value is not specified, the UsedYValueLow value will be the second YValue which is at index 1 (one).
Example
This example demonstrates how to use the UsedYValueLow custom attribute.
| Visual Basic | Copy Code |
|---|---|
|
|
| C# | Copy Code |
|---|---|
|
|
The BoxSize Attribute
The BoxSize defines the Point and Figure box size. By default, 4% of the difference between highest and lowest price is used. A fixed value can like 2.5, or a percent of price difference like 3%, can also be used.
Example
This example demonstrates how to use the BoxSize custom attribute.
| Visual Basic | Copy Code |
|---|---|
|
|
| C# | Copy Code |
|---|---|
|
|
The CurrentBoxSize Attribute
The CurrentBoxSize is a read-only attribute that you can access to get the value of the calculated, or default box size. This attribute can be accessed only from within customization events.
Example
This example demonstrates how to use the CurrentBoxSize custom attribute.
| Visual Basic | Copy Code |
|---|---|
|
|
| C# | Copy Code |
|---|---|
|
|
The ReversalAmount Attribute
The ReversalAmount defines a custom reversal amount, in box sizes, for the chart. The default is three box sizes.
Example
This example demonstrates how to use the ReversalAmount custom attribute.
| Visual Basic | Copy Code |
|---|---|
|
|
| C# | Copy Code |
|---|---|
|
|
The ProportionalSymbols Attribute
The ProportionalSymbols indicates that Point and Figure chart should attempt to draw X and O symbols proportionally. This is done by adding an empty space on the right side, but only if width of the symbol is too big. By default this value is set to true. In 3D no symbols are drawn, therefore this attribute is not used.
Example
This example demonstrates how to use the ProportionalSymbols custom attribute.
| Visual Basic | Copy Code |
|---|---|
|
|
| C# | Copy Code |
|---|---|
|
|
The PriceUpColor Attribute
The PriceUpColor custom attribute defines the color used to draw up lines, which are filled with Xs. By default a darker color based on Series.Color is used. The color may be defined as a name, or a '\' escaped, comma-separated, RGB color value.
Example
This example demonstrates how to use the PriceUpColor custom attribute.
| Visual Basic | Copy Code |
|---|---|
|
|
| C# | Copy Code |
|---|---|
|
|
| Note |
|---|
| When this chart is in 3D mode, lines are visually separated only by their color. This means that no X or O symbols are drawn on the chart. |
|
Chart Details |
|
|---|---|
|
Number of Y values per point: |
2 |
|
Number of series: |
One |
|
Support markers: |
Yes |
|
Cannot be combined with: |
Doughnut, Pie, Bar |
|
Custom Attributes |
|---|
|
UsedYValueHigh, UsedYValueLow, BoxSize, ReversalAmount, PriceUpColor, ProportionalSymbols |
 See Also
Chart Types
Chart Types Overview