


Overview

The Polar chart type is a circular graph on which data points are displayed using the angle, and the distance from the center point. The X axis is located on the boundaries of the circle and the Y axis connects the center of the circle with the X axis.
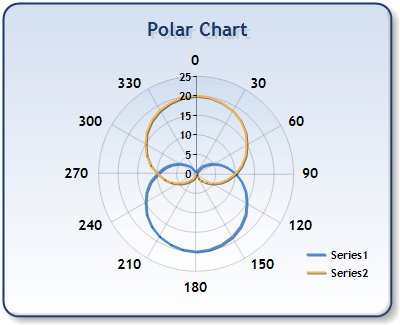
Figure 2: A Polar chart showing two series.
By default, the angle scale ranges from 0 to 360 degrees. However, the X Axis Minimum and Maximum properties may be used to specify a different angular scale. The Minimum angle value starts at the top (12 O'Clock position) of the chart but can be changed to another angle using the Crossing property. For example, setting the Crossing property to 90 will move the "zero" value to the 3 O'Clock position.
|
Chart Details |
|
|---|---|
|
Number of Y values per point: |
1 |
|
Number of series: |
One or more |
|
Support markers: |
Yes |
|
Cannot be combined with: |
Any other chart types. |
|
Custom Attributes |
|
|
Gets or sets the data point label position |
|
|
Gets or sets the shape of the polar chart area |
|
|
Gets or sets the label drawing style |
|
|
Gets or sets the polar chart drawing style |
|
|
Determines how an Empty Point is treated when the chart is rendered. |
|
 See Also
Chart Types
Chart Types Overview