


Overview

The Positive Volume Index should be used together with the Negative Volume index . The Positive volume index only changes if the volume decreases from the previous day.
 Note Note |
|---|
| We recommend that you read Using Financial Formulas before proceeding any further. Using Financial Formulas provides a detailed explanation on how to use formulas, and also explains the various options available to you when applying a formula. |
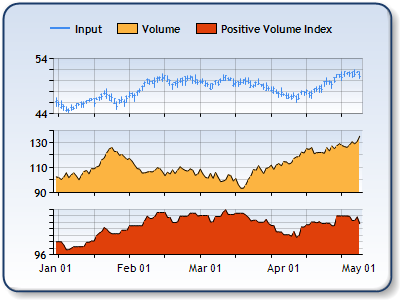 |
| Figure 1: The Positive Volume index is in the lower chart area, and Volume is in the middle chart area. The High, Low and Close prices are plotted in the upper chart area as a Stock Chart. |
Applying a Positive Volume Index Formula
All formulas are calculated using the FormulaFinancial method, which accepts the following types of arguments: a formula name; input value(s); output value(s), and parameter(s) that are specific to the type of formula being applied.
Also, before applying the FormulaFinancial method, make sure that all data points have their XValue property set, and that their series' XValueIndexedproperty has been set to false.
The following table indicates what sort of FormulaFinancial method arguments to use when calculating a Positive Volume Index, and also supplies a description of what these parameters mean:
| Parameter |
Value/Description |
Example |
|---|---|---|
| Formula Name: |
PositiveVolumeIndex
|
FormulaFinancial(FinancialFormula.PositiveVolumeIndex,"100","Series1:Y4,Series2:Y","Series3:Y") |
| Input Values: |
Value #1: Value which represents the Close price. By default this is the fourth Y value in the stock chart. |
FormulaFinancial(FinancialFormula.PositiveVolumeIndex,"100"," Series1:Y4,Series2:Y","Series3:Y") |
| Output Value: (optional) |
Positive Volume Index. If not specified output is stored in the first input value. |
FormulaFinancial(FinancialFormula.PositiveVolumeIndex,"100","Series1:Y4,Series2:Y"," Series3:Y") |
|
Parameter: |
Start Value, is initial value for Positive Volume index (Double value). |
FormulaFinancial(FinancialFormula.PositiveVolumeIndex,"100","Series1:Y4,Series2:Y","Series3:Y") |
A line chart is a good choice when displaying a Positive Volume Index series.
Financial Interpretation: When the Positive Volume index is below its moving average there is higher probability for a bear market. The probability for a bear market is much lower when the positive volume index is above it's moving average.
Calculation:
If Today's volume is greater than yesterday's volume.
PVI(today) = ( Close(today) - Close(yesterday) ) / Close(yesterday) * PVI(yesterday) + PVI(yesterday)
If Today's volume is lower than yesterday's volume.
PVI(today) = PVI(yesterday)
Example
This example demonstrates how to calculate Positive Volume Index.
| Visual Basic |  Copy Code Copy Code |
|---|---|
| |
| C# | Copy Code |
|---|---|
| |