


Overview

The Price Volume Trend is a cumulative volume total that is calculated using relative changes of the Close price, and should be used with other indicators.
 Note Note |
|---|
| We recommend that you read Using Financial Formulas before proceeding any further. Using Financial Formulas provides a detailed explanation on how to use formulas, and also explains the various options available to you when applying a formula. |
 |
|
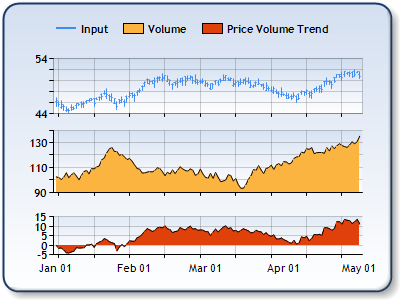
Figure 1: The Close Price in the upper chart area, the Volume in the middle chart area, and the Price Volume trend in the lower chart area. |
Applying a Price Volume Trend
All formulas are calculated using the FormulaFinancial method, which accepts the following types of arguments: a formula name; input value(s); output value(s), and parameter(s) that are specific to the type of formula being applied.
Also, before applying the FormulaFinancial method, make sure that all data points have their XValue property set, and that their series' XValueIndexedproperty has been set to false.
The following table indicates what sort of FormulaFinancial method arguments to use when calculating a Price Volume Trend, and also supplies a description of what these parameters mean:
| Parameter |
Value/Description |
Example |
|---|---|---|
| Formula Name: |
PriceVolumeTrend
|
FormulaFinancial(FinancialFormula.PriceVolumeTrend,"Series1:Y43,Series2:Y","Series3:Y") |
| Input Values: | Value #1: The value which represents the Close price. In the Dundas chart by default it is the fourth Y value in the stock chart.
Value #2: The value which represents Volume. |
FormulaFinancial(FinancialFormula.PriceVolumeTrend,"Series1:Y4,Series2:Y","Series3:Y") |
| Output Value: (optional) |
Price Volume Trend. If not specified output is stored in the first input value. |
FormulaFinancial(FinancialFormula.PriceVolumeTrend,"Series1:Y4,Series2:Y"," Series3:Y") |
|
Parameter: |
- |
- |
A line chart is a good choice when displaying a price volume trend series.
Financial interpretation: When the Price Volume Trend goes up then there is an up-trend. When the Price Volume Trend goes down there is a down-trend.
If there is bullish divergence between the Price volume trend and price it could be a signal that the market is at the bottom. When there is bearish divergence between the Price Volume Trend and price it could be a signal that the market is at the top.
Calculation: The first step to calculate Price volume trend is to find percentage change in the close price:
Change = (Close(today) - Close(yesterday) ) / Close(yesterday)
Price volume trend (PVT) is calculated using following formula:
PVT(today) = Change * Volume(today) + PVT(yesterday)
Example
This example demonstrates how to calculate Price Volume Trend.
| Visual Basic |  Copy Code Copy Code |
|---|---|
| |
| C# | Copy Code |
|---|---|
| |