


Overview

The Pyramid Chart displays data that, when combined, equals 100%. These charts are single series charts representing data as portions of a 100% total, and do not use an axis.
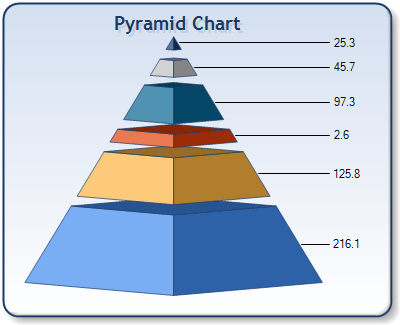
Figure 1: A Pyramid chart showing portions of a 100% total.
The Pyramid chart can be displayed in 2D, or in 3D. In 3D, the chart may be shown in a Pyramidical, or a Conical form.
Both X and Y values support linear, and logarithmic scales, however, by default the linear scales are used. You can control the Logarithmic scales by using the axis Logarithmic, and LogarithmicBase properties.
|
Chart Details |
|
|---|---|
|
Number of Y values per point: |
1 |
|
Number of series: |
1 |
|
Support markers: |
No |
|
Cannot be combined with: |
Any other chart types. |
|
Custom Attributes |
|
|---|---|
|
Gets or sets the pyramid data point label style. |
|
|
Gets or sets the minimum height of the data point in relative coordinates. |
|
|
Gets or sets the 3D rotation angle for the pyramid chart. |
|
|
Gets or sets the gap between the points in relative coordinates. |
|
|
Gets or sets the drawing style for 3D pyramid charts. |
|
|
Gets or sets the vertical alignment of the data point labels when placed inside the pyramid. |
|
|
Gets or sets the outside label placement relative to the pyramid. |
|
|
Gets or sets the point label callout line color |
|
 See Also
Chart Types
Chart Types Overview