


Overview

The Renko charting method is thought to have acquired its name from Renga, a Japanese word for bricks. Renko charts isolate the underlying price trends by filtering out minor price changes. These charts can be very useful for determining major trend lines, or support and resistance levels.
Basic trend reversals are signaled with the emergence of a new color brick which depends on the choice of colors used in the series. Since the Renko chart is used as a trend following aid, there are times when Renko charts produce whip saws, giving signals near the end of short-lived trends. However, the expectation with any trend following technique is that it allows you to ride the major portion of any significant trends.
Renko charts are normally based on closing price values. However, unless otherwise specified, the value reflected in the chart will be the first YValue. You can also specify a box size that determines the minimum price change to display in the chart. The default box size is calculated from the average share price over the charted period.
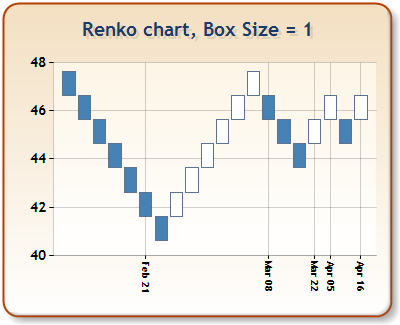
Figure 1: A Renko chart using a box size of 1.
Working with Renko Charts
The following should be taken into account when working with Renko charts:
- The X values of data points are automatically indexed. For more information on indexing, see the topic on Indexing Data Point X Values.
- There is a formula applied to the original data before that data gets plotted. This formula changes the number of points in the data, and also changes the data points' X/Y values.
- Due to data being recalculated, we do not recommend setting the minimum and/or maximum values for the X axis. This is because it cannot be determined how many data points will actually be plotted. However, if the axis' Maximum, or Minimum is set, then the Maximum, or Minimum properties should use data point index values.
- Data point anchoring, used for annotations, is not supported in this type of chart.
 Note Note |
|---|
|
The Renko Chart Type cannot be combined with any other Chart Types. |
Using Custom Attributes
The Renko chart uses the custom attributes to customize the chart display, and behavior. These custom attributes include the UsedYValue, BoxSize, and CurrentBoxSize attributes. Each one of these attributes is discussed below, along with a code sample demonstrating the syntax used to set the attribute.
The UsedYValue Attribute
The UsedYValue attribute, for a Series with multiple YValues, defines a zero based index of which Y values to use. If the UsedYValue value is not specified, the Renko chart will use the first YValue, which is found at index zero.
Example
This example demonstrates how to use the UsedYValue custom attribute.
| Visual Basic |  Copy Code Copy Code |
|---|---|
|
|
| C# | Copy Code |
|---|---|
|
|
The BoxSize Attribute
The BoxSize attribute defines a custom Renko box size. By default, 4% of the difference between highest and lowest price is used for the box size. Either a fixed value, for example 2.5, or a percent of price difference, like 3%, can be used.
Example
This example demonstrates how to use the BoxSize custom attribute.
| Visual Basic | Copy Code |
|---|---|
|
|
| C# | Copy Code |
|---|---|
|
|
The CurrentBoxSize Attribute
The CurrentBoxSize attribute is a read-only attribute that can accessed to get the value of the calculated, or default box size. This attribute can be accessed only in customization events.
Example
This example demonstrates how to use the CurrentBoxSize custom attribute.
| Visual Basic | Copy Code |
|---|---|
|
|
| C# | Copy Code |
|---|---|
|
|
The PriceUpColor Attribute
The PriceUpColor custom attribute defines the color to use in the Renko chart to display an uptrend. When a downtrend occurs, the Renko chart will use the default series color to display it. These colors may be specified using their known color names, or by RGB values (commas are escaped using the '\' character).
Example
This example demonstrates how to use the PriceUpColor custom attribute.
| Visual Basic | Copy Code |
|---|---|
|
|
| C# | Copy Code |
|---|---|
|
|
|
Chart Details |
|
|---|---|
|
Number of Y values per point: |
1 |
|
Number of series: |
One |
|
Support markers: |
Yes |
|
Cannot be combined with: |
Doughnut, Pie, Bar |
|
Custom Attributes |
|---|
 See Also
Chart Types
Chart Types Overview