


Overview

A Simple Moving Average is an average of data calculated over a period of time. The moving average is the most popular price indicator used in technical analyses. This average can be used with any price including the Hi, Low, Open, or Close, and can be applied to other indicators too. A moving average smoothens a data series, which is very important in a volatile market as it helps to identify significant trends. Dundas Chart for ASP.NET has four types of moving averages including Simple, Exponential, Triangular, and Weighted. The most important difference between the above moving averages is how they weight their datapoints.
 Note Note |
|---|
| We recommend that you read Using Financial Formulas before proceeding any further. Using Financial Formulas provides a detailed explanation on how to use formulas, and also explains the various options available to you when applying a formula. |
 |
|
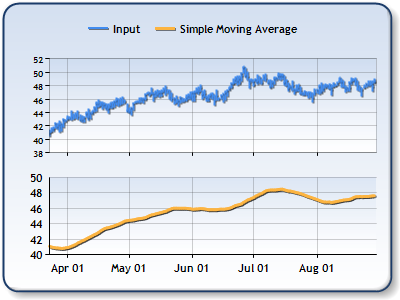
Figure 1: A 10 day Moving Average, along with the High, Low, and Closeprices using a stock chart. |
Applying a Simple Moving Average
All formulas are calculated using the FormulaFinancial method, which accepts the following arguments: a formula name; input value(s); output value(s), and parameter(s) that are specific to the type of formula being applied.
Before applying the FormulaFinancial method, make sure that all data points have their XValue property set, and that their series' XValueIndexed property is set to false.
The following table indicates what sort of FormulaFinancial method arguments to use when calculating a Simple Moving Average, and also supplies a description of what these parameters mean:
| Parameter |
Value/Description |
Example |
|---|---|---|
| Formula Name: |
MovingAverage
|
FormulaFinancial(FinancialFormula.MovingAverage,"20","Series1:Y2","Series2:Y") |
| Input Value: | The value for which the moving average has to be calculated. It could be a price such as: Hi, Low, Open and Close value. The most used price is closed. |
FormulaFinancial(FinancialFormula.MovingAverage,"20","Series1:Y2","Series2:Y") |
| Output Value: (optional) |
The Moving average. If not specified output is stored in the first input value. |
FormulaFinancial(FinancialFormula.MovingAverage,"20","Series1:Y2"," Series2:Y") |
|
Parameter: |
Period property, used to determine a time period which is used in Moving Average |
FormulaFinancial(FinancialFormula.MovingAverage,"20","Series1:Y2","Series2:Y") |
A line chart is a good choice when displaying a simple moving average.
Financial Interpretation: The Moving Average is used to compare a security's prices with it's moving average. The most important element used in calculating the moving average is a time period, which should be equal to the observed market cycle.
The moving average is a lagging indicator, and will always be behind the price. When the price is following a trend the moving average is very close to the security's price. When a price is going up, the moving average will probably stay down due to the influence of the historical data.
Calculation: The moving average is calculated using the following formula:

In the previous formula the n-value represents a time period. The most common time periods are: 10 Days, 50 Days and 200 Days.
A moving average moves because as each new data point is added the oldest data point is dropped. A simple moving average gives equal weight to each data point price.
Example
This example demonstrates how to calculate a 20 days Moving average using the Formula method.
| Visual Basic |  Copy Code Copy Code |
|---|---|
| |
| C# | Copy Code |
|---|---|
| |