


Overview

The Three Line Break chart is popular in Japan for financial charting. These charts display a series of vertical boxes ("lines") that reflect changes in price values. Similar to Kagi, Renko, and Point & Figure charts, the Three Line Break chart ignores the passage of time.
The Three Line Break charting method is so-named because of the number of lines typically used. Each line may indicate "Buy", "Sell", and "trend less" markets. An advantage of Three Line Break charts is that there is no arbitrary fixed reversal amount. It is the price action which gives the indication of a reversal. The disadvantage of Three Line Break charts is that the signals are generated after the new trend is well under way. However, many traders are willing to accept the late signals in exchange for calling major trends.
The sensitivity of the reversal criteria can be set by changing the number of lines in the break. For example, short-term traders might use two-line breaks to get more reversals, while a longer-term investor might use four-line, or even 10-line breaks to reduce the number of reversals. This is done using the NumberOfLinesInBreak custom attribute.
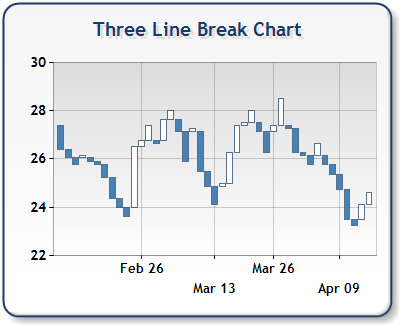
Figure 1: A Three Line Break chart.
Working with Three Line Break Charts
The following should be taken into account when working with Three Line Break charts:
- The X values of data points are automatically indexed. For more information on indexing, see the topic on Indexing Data Point X Values.
- There is a formula applied to the original data before that data gets plotted. This formula changes the number of points in the data, and also changes the data points' X/Y values.
- Due to data being recalculated, we do not recommend setting the minimum and/or maximum values for the X axis. This is because it cannot be determined how many data points will actually be plotted. However, if the axis' Maximum, or Minimum is set, then the Maximum, or Minimum properties should use data point index values.
- Data point anchoring, used for annotations, is not supported in this type of chart.
 Note Note |
|---|
|
The Three Line Break Chart Type cannot be combined with any other Chart Types. |
Using Custom Attributes
You can use custom attributes to fully customize the Three Line Break chart. These custom attributes include: UsedYValue, NumberOfLinesInBreak, and PriceUpColor attributes.
The UsedYValue attribute, for a Series with multiple YValues, defines a zero based index value of which Y value to use. If this value is not specified, the Three Line Break chart will use the first YValue which is at index 0 in the series.
Example
This example demonstrates how to use the UsedYValue custom attribute.
| Visual Basic |  Copy Code Copy Code |
|---|---|
|
|
| C# | Copy Code |
|---|---|
|
|
The NumberOfLinesInBreak defines the number of lines to use in the Three Line Break. The default value is 3.
Example
This example demonstrates how to use the NumberOfLinesInBreak custom attribute.
| Visual Basic | Copy Code |
|---|---|
|
|
| C# | Copy Code |
|---|---|
|
|
The PriceUpColor custom attribute defines the color to use when the Three Line Break chart is on an uptrend. The Three Line Break chart will use the default series color when its on a downtrend. Colors may be specified by their known color names, or by RGB values (commas are escaped using the '\' character).
Example
This example demonstrates how to use of the PriceUpColor custom attribute.
| Visual Basic | Copy Code |
|---|---|
|
|
| C# | Copy Code |
|---|---|
|
|
|
Chart Details |
|
|---|---|
|
Number of Y values per point: |
1 |
|
Number of series: |
One |
|
Support markers: |
Yes |
|
Cannot be combined with: |
Doughnut, Pie, Bar |
|
Custom Attributes |
|---|
 See Also
Chart Types
Chart Types Overview