


Overview

William's %R is a momentum indicator, and is used to measure overbought, or oversold levels. This indicator is very similar to the Stochastic %K indicator, except that Williams %R is always a negative value between 0 and -100. This indicator was developed by Larry Williams.
 Note Note |
|---|
| We recommend that you read Using Financial Formulas before proceeding any further. Using Financial Formulas provides a detailed explanation on how to use formulas, and also explains the various options available to you when applying a formula. |
 |
|
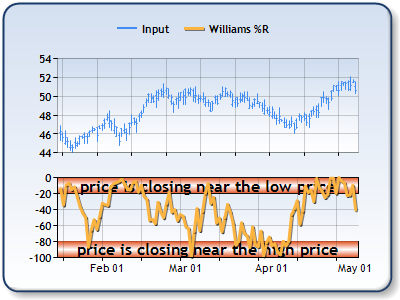
Figure 1: The William's %R in the lower chart area, and High, Low and Close prices are plotted in the upper chart area as a stock chart. |
Applying a William's %R Formula
All formulas are calculated using the FormulaFinancial method, which accepts the following types of arguments: a formula name; input value(s); output value(s), and parameter(s) that are specific to the type of formula being applied.
Also, before applying the FormulaFinancial method, make sure that all data points have their XValue property set, and that their series' XValueIndexedproperty has been set to false.
The following table indicates what sort of FormulaFinancial method arguments to use when implementing a William's %R formula, and also supplies a description of what these parameters mean:
| Parameter |
Value/Description |
Example |
|---|---|---|
| Formula Name: |
WilliamsR
|
FormulaFinancial(FinancialFormula.WilliamsR,"15","Series1:Y,Series1:Y2,Series1:Y4","Series3:Y") |
| Input Value: | Value #1: Value which represents the High price. By default this is the first Y value in the stock chart. Value #2: Value which represents the Low price. By default this is the second Y value in the stock chart.
Value #3: Value which represents the Close price. By default this is the fourth Y value in the stock chart. |
FormulaFinancial(FinancialFormula.WilliamsR,"15","Series1:Y,Series1:Y2,Series1:Y4","Series3:Y") |
| Output Value: (optional) |
The William's %R indicator. If not specified output is stored in the first input value. |
FormulaFinancial(FinancialFormula.WilliamsR,"15","Series1:Y,Series1:Y2,Series1:Y4"," Series3:Y") |
|
Parameter: |
Period, used to calculate William's %R (Default value is 14). |
FormulaFinancial(FinancialFormula.WilliamsR,"15","Series1:Y,Series1:Y2,Series1:Y4","Series3:Y") |
A line chart is a good choice when displaying a William's %R series.
Financial Interpretation: This formula is very similar to the Stochastic Indicator formula, the difference being that William's %R is plotted on a negative scale and does not use internal smoothing.
The value for the William's %R indicator is always between 0 and -100, and is represented as a percentage. If the value is below -80 then the price is closing near the high price. If the value is above -20 then the price is closing near its low.
Calculation: The William's %R indicator is calculated on the following way:
%R = (( HH - Today's Close ) / ( HH - LL )) * -100
where:
LL = Lowest Low price in Period
HH = Highest High price in Period
Example
This example demonstrates how to calculate William's %R.
| Visual Basic |  Copy Code Copy Code |
|---|---|
| |
| C# | Copy Code |
|---|---|
| |