


Overview
Candlestick charts are used to display stock information using High, Low, Open and Close values. The size of the line is determined by the High and Low values, while the size of the bar is determined by the Open and Close values. The Open/Close bar is displayed using different colors, and depends on whether the stock's price has gone up or down.
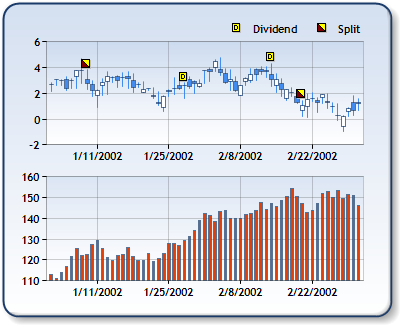
Figure 1: A Candlestick chart.
If the close value is higher than the open value than the color of the bar is determined by the PriceUpColor custom attribute. If the close value is lower than the open value than the color of the bar is determined by the PriceDownColor custom attribute. Note that these custom attributes must be set explicitly (by default they are not set).
|
Chart Details |
|
|---|---|
|
Number of Y values per point: |
4 (High, Low, Open and Close, respectively) |
|
Number of series: |
One or more |
|
Support markers: |
Yes |
|
Cannot be combined with: |
Doughnut, Pie, Bar, Stacked Bar charts, Polar, Radar, Pyramid, or Funnel |
|
Custom Attributes |
|---|
 See Also
Chart Types
Chart Types Overview
Stock Chart