


Aligns data points from different series along the X axis using their axis labels. The specified series in the chart are aligned, using an ascending sort order.
Aligns data points using their axis labels.
 Syntax
| Visual Basic (Declaration) | |
|---|---|
Public Overloads Sub AlignDataPointsByAxisLabel( _ ByVal series As String _ ) | |
| Visual Basic (Usage) |  Copy Code Copy Code |
|---|---|
| |
Parameters
- series
- Determines the series that will have their data points aligned to the X axis using the data point axis labels.
Comma separated list of series that should be aligned by axis label.
Remarks
This method is used to align data points from different series along the X axis using their axis labels, and is applicable when:
- multiple series are being displayed and are indexed (i.e. all points have an XValue of 0, or Series.XValueIndexed is true ).
- all data points have non-empty axis labels, which are unique to their series (otherwise an exception will be thrown).
This situation is very common when data-binding results in the creation of multiple series, and string values are being used for X axis values.
Two issues arise when multiple, indexed series are plotted, and the X-values are being set using string values:
- We cannot guarantee that data points from different series with the same string X-values will be plotted at the same index along the X axis;
- Only the axis label for the first series' point will be displayed, even though points from other series with the same index have axis labels too.
For example, in Figure 1 below two series are plotted, each with two data points. The first series' points have the following labels: "Point 1 - Series 1" and "Point 2". The second series has these axis labels: "Point 1 - Series 2" and "Point 2". In the left-hand image the first points in the two series are plotted together, since they have an index of 0.
However, if we call AlignDataPointsByAxisLabel the first points in the two series are separated and plotted at different locations along the X axis since they have different axis labels (see Figure 1 below). In effect calling this method allows for the X-value, which is a string, to determine where data points are plotted. The second points are not separated since they both have an axis label of "Point 2".
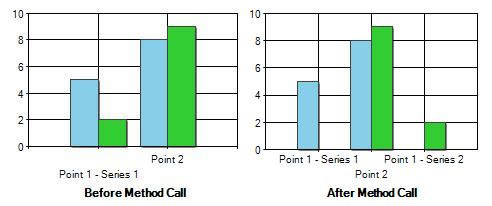
Figure 1: Data points are aligned using their axis values.
By default points are plotted in the order that they are stored in their series. To specify a sort order use a definition that has a sortingOrderparameter.
Requirements
Target Platforms: Windows 98, Windows NT 4.0, Windows Millennium Edition, Windows 2000, Windows XP Home Edition, Windows XP Professional, Windows Server 2003 family, Windows Vista, Windows Server 2008 family