


Overview
This article describes how to use a Site List as a datasource for your chart web part, and picks up where Step 1: Choose A Data Source of the Data Connection Wizard left off. This article is specifically written for users who chose the Connect To A Site List option in step 1 of the wizard.
Step 2: Connect To Your Data Source
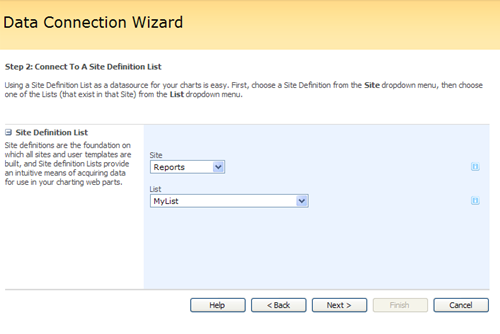
The next step is to choose a Site from the Site dropdown menu. Once a site has been chosen, the List dropdown menu is automatically populated with all of the Lists that exist within that Site. Choose a List to use, and proceed to the next step.
 |
|
Figure 1: Choose a Site, and a List to use as a data source for your chart web part. |
Step 3: Retrieve Data
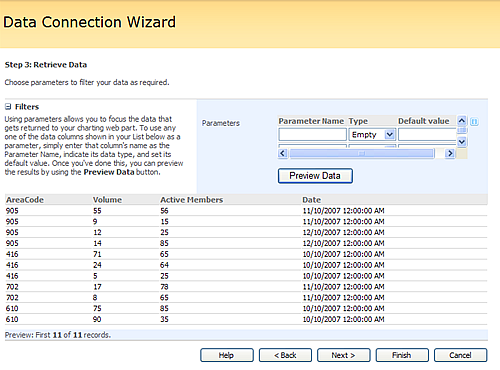
In Step 3 of this process, you will have the opportunity to filter the data that eventually gets used by your chart by setting Parameters. Any data column in your List can be used as a filtering parameter. In order to set a data column as a Parameter, simply enter that column's name in the field provided, indicate its data type, and set its default value. Then you can proceed to preview the data returned by using the Preview Data button.
 |
|
Figure 2: Use any data column from your List as a filtering Parameter. No parameters have been set above, so all of the data in the list is returned. |
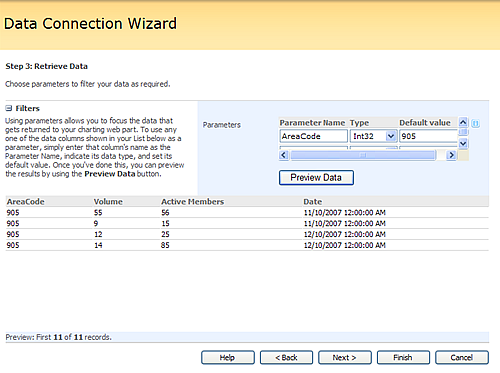
Figure 3 below demonstrates the data returned when we use the AreaCode data column as a parameter to filter out all records that do not have the default value of 905 in their AreaCode column. Clicking on the Preview Data button produces the results shown in Figure 3 below.
 |
|
Figure 3: The AreaCode data column is being used as a Parameter to filter out all records that do not have the value 905 in that column. |
Step 4: Bind Your Chart To Data
In this step you will have the opportunity to define how your chart web part will bind to your datasource's Series or Fields, and you will also be able to use Formulas, set Tooltips, set Hyperlink Fields, add Labels, define Custom Fields, and set other Advanced Properties. This dialog screen lets you control exactly how your charting web part will use the data the it retrieves from your datasource.
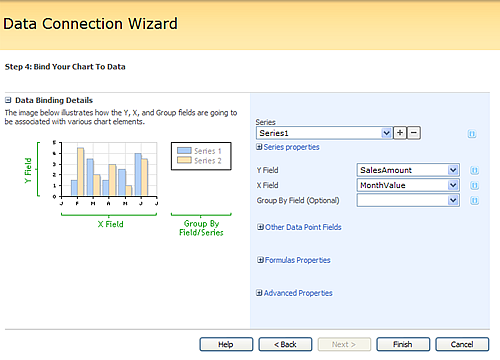
Figure 4: In this step, choose the particulars for binding your chart to your data source.
Once all of the above steps are complete, click on the Finish button to exit the Data Connection Wizard and return to the designer screen where you can view your data.