Overview
This article describes how to use a external database or spreadsheet as a datasource for your chart web part, and picks up where Step 1: Choose A Data Source of the Data Connection Wizard left off. This article is specifically written for users who chose the Connect To Data From An External Database Or Spreadsheet option in step 1 of the wizard.
Step 2: Connect To Your Data Source
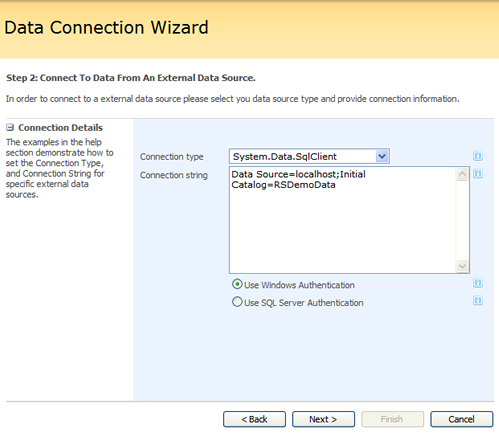
The next step in this process is to select a connection type and enter a connection string for your data connection. In this step you will also have to choose either Windows authentication, or SQL server authentication to access your new data connection. Depending on the type of connection that you choose, the security permissions in place, and your individual user account permissions, the connection string used will vary. Figure 1 shows step 2 in this process.
 |
| Figure 1: Set a connection type, and a connection string for your new data connection. You must also choose an authentication method. |
Step 3: Retrieve Data
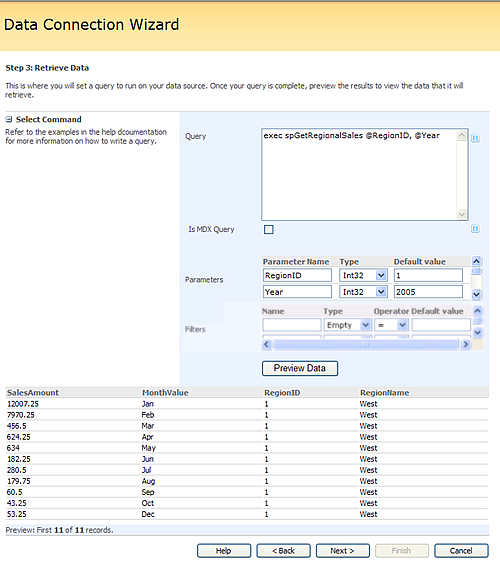
The third step in this process involves setting a query to use on your data connection. This in essence is where you will retrieve your data. Once you have created your query, you can then preview the data that your query retrieves by click on the Preview Data button. Figure 2 shows the query that was run along with the results of running that query.

Figure 2: Run your query and preview the data results.
Step 4: Bind Your Chart To Data
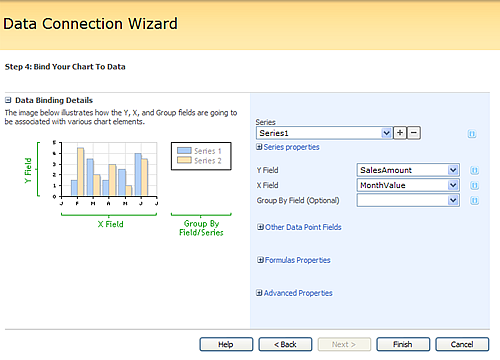
In this step you will have the opportunity to define how your chart web part will bind to your datasource's Series or Fields, and you will also be able to use Formulas, set Tooltips, set Hyperlink Fields, add Labels, define Custom Fields, and set other Advanced Properties. This dialog screen lets you control exactly how your charting web part will use the data the it retrieves from your datasource.

Figure 3: In this step, choose the particulars for binding your chart to your data source.
Once all of the above steps are complete, click on the Finish button to exit the Data Connection Wizard and return to the designer screen where you can view your data.


