


Overview
This article describes how to use an Excel service as a datasource for your chart web part, and picks up where Step 1: Choose A Data Source of the Data Connection Wizard left off. This article is specifically written for users who chose the Connect To Data From Excel Services option in step 1 of the wizard.
Step 2: Connect To Your Data Source
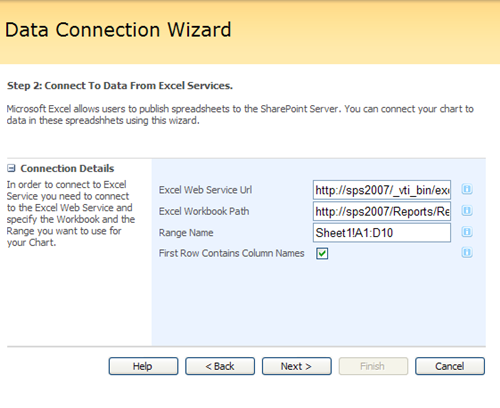
The next step is to define the paths in order to have your chart web part access your Excel Services resources. You must also define the range of values that you want to use in your Excel spreadsheet. In Figure 1 below, we have defined using all values found in Sheet 1 from cells A1 to D10 inclusively. Once all paths, and data access particulars have been set you can then proceed to the next step.
 |
|
Figure 1: Set the paths to access your Excel resources. |
The Excel Web Services Url should be populated with the default Excel Web Services.
The Excel Workbook Path is the path and file name of the spreadsheet.
Range Name is the selection of data that will be used by the Dundas web parts. It uses the Microsoft syntax for specifying a range in Excel, e.g. A1:B25.
The First Row Contains Column Names option should be checked if the selected range contains a header in the first row. The text in the first row will represent the column names.
Step 3: Retrieve Data
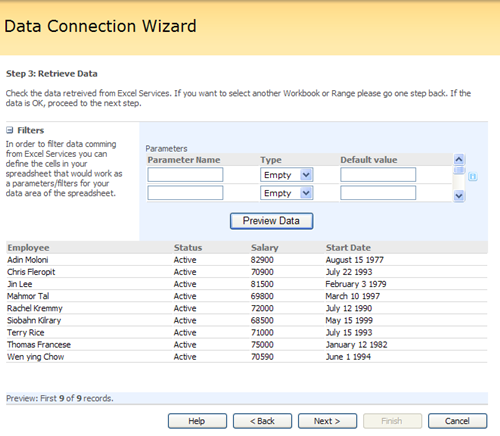
In Step 3 of this process, you will have the opportunity to filter the data that eventually gets used by your chart by setting Parameters. Any data column in your List can be used as a filtering parameter. In order to set a data column as a Parameter, simply enter that column's name in the field provided, indicate its data type, and set its default value. Then you can proceed to preview the data returned by using the Preview Data button.
 |
|
Figure 2: You can use any data column as a filtering Parameter. No parameters have been set above, so all of the data available is returned. |
Step 4: Bind Your Chart To Data
In this step you will have the opportunity to define how your chart web part will bind to your datasource's Series or Fields, and you will also be able to use Formulas, set Tooltips, set Hyperlink Fields, add Labels, define Custom Fields, and set other Advanced Properties. This dialog screen lets you control exactly how your charting web part will use the data the it retrieves from your datasource.
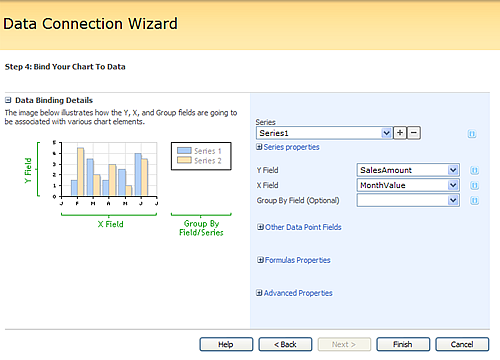
Figure 4: In this step, choose the particulars for binding your chart to your data source.
Once all of the above steps are complete, click on the Finish button to exit the Data Connection Wizard and return to the designer screen where you can view your data.