Overview
Multiple charts can be combined within a common Chart web part in order to allow you to create immediate visual comparisons when viewing complementary data sets. This article discusses how to combine multiple chart within a common chart control web part.
There are two ways to display multiple charts:
Multiple Series Within One Chart Area
Displaying multiple data Series within a common Chart Area is the usual manner in which to plot data. However, some chart types are not compatible with others, and therefore cannot co-exist within a common chart area. For example, a bar chart and column chart are not compatible since they require the use of very different axes. Only compatible chart types may be displayed with the same chart area.
Follow these steps to display two data Series within a common Chart Area:
- Add a chart web part to your project in the usual manner.
- Choose Connect To Data from the web part dropdown menu.
- Use the Data Connection Wizard to connect your charting web part to a suitable data source.
- In Step 4:Bind Your Chart To Data, select a Series from the dropdown menu and assign a data column to the Y Field and X Field.
- Click Finish to complete this task, and exit the wizard.
 Note Note |
|---|
| When a chart instance is created at design-time, one default series and one chart area are automatically created for you. |

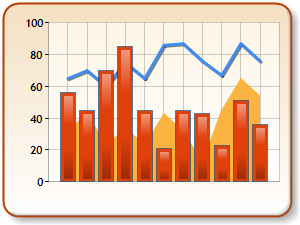
Figure 1: Multiple series in one chart area.
Multiple Chart Areas Within One Web Part
A chart web part container can display an unlimited number of Chart Areas, as long as each ChartArea member has its own unique name. In order to display any given Chart Area, you must connect it to a data Series. By default, all data Series are associated with the Default Chart Area that is created when you first add a chart web part to your project.
In the instructions that follow, we assume that you have added a chart web part to your project, and that you have connected it to an existing data source.
Adding Another Chart Area To Your Web Part
Follow these steps to add an additional Chart Area to an existing Chart web part:
- Go to Advanced Properties, and choose Chart Areas from the left-hand navigation menu.
- In Chart Areas, beside the Axis Menu there is a [+] icon, click this icon to add a new Chart Area.
- Click on Finish to exit the Advanced Properties screen.
Assign A Data Series To Your New Chart Area
Follow these steps to assign a data Series to your new Chart Area:
- Choose Connect To Data from the web part dropdown menu.
- In the Data Connection Wizard, you should automatically arrive at Step 4:Bind Your Chart To Data. This is the default behavior when your chart is already connected to a data source.
-
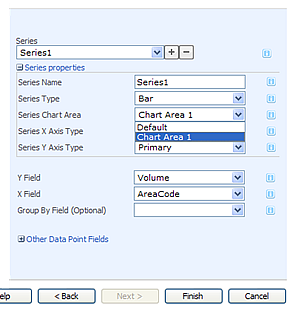
Expand the Series Properties area, as shown in Figure 2 below, and choose your new Chart Area, Chart Area 1 from the Series Chart Area dropdown menu.

Figure 2: Select your new chart area, ChartArea1.
- Select an appropriate value for the Y Field and X Field.
- Click Finish to complete the task, and exit the wizard.
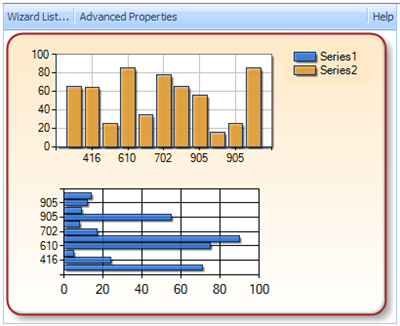
The chart web part shown in Figure 3 below demonstrates the use of two Chart Areas within one common chart web part container. As you can see, the data shown within this chart is presented in a manner that makes visual comparisons easier, and more intuitive.
 Note Note |
|---|
| When a chart instance is created at design-time one default series, and one chart area are automatically created for you. |
 |
|
Figure 3: Multiple series in two chart areas. |


