Overview
This topic discusses various aspects of Error Bar Charts including how to use custom attributes to change the appearance, and behavior of these charts.
Working with Error Bar Charts
Error bar charts consist of lines with markers that are used to display statistical information about the data displayed in a graph. An Error Bar chart type is a series that has 3 Y values. While it is true that these values can be assigned to each point in an Error Bar chart, in most cases, the values will be calculated from the data present in another series. The order of the Y values is important because each position in the array of values represents a value on the Error Bar.
|
0 |
Center or Average point value |
|
1 |
Lower Error value |
|
2 |
Upper Error value |

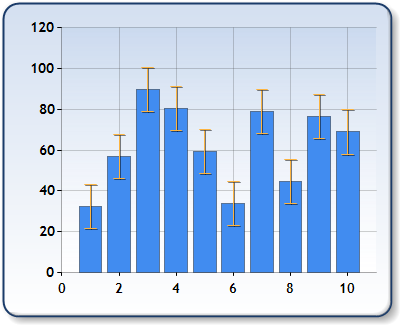
Figure 1: A column chart with error bars shown.
By default, the Error Bar chart shows both lower, and upper errors. However, using the ErrorBarStyle attribute you may show only upper or lower error.
The values possible for the ErrorBarStyle attribute include:
|
Both |
The default value. It shows both upper and lower error bars |
|
UpperError |
Only the upper error is shown |
|
LowerError |
Only the lower error is shown |
All standard markers styles can be used with the error bar using the MarkerStyle property. When markers are not set, which is the default behavior, the horizontal lines will be displayed as in the stock chart. By default, a marker for the center value of the error bar is not shown however the custom attribute, ErrorBarCenterMarkerStyle, can be used to change this behavior.
The possible values for this ErrorBarCenterMarkerStyle attribute include: None (this is the default), Line, Square, Circle, Diamond, Triangle, and Cross.
The width of Error Bar lines can be controlled by the PointWidth custom attribute. Setting the PointWidth custom attribute to zero will hide the error tick marks resulting in a single vertical line being drawn.
Using Custom Attributes
In most of the cases the data point values of the Error Bar chart are calculated using formulas applied to data existing in other series. A series custom attribute, like ErrorBarSeries, can be used to attach the Error Bar series to other pre-existing series, and to define the formula used in calculations. This will also allow you to view the error bars for any series, even at design-time.
The ErrorBarSeries Attribute
If the ErrorBarSeries attribute is set to the name of a series, the first Y value of the named series will be used as a center value for the error bar. You have the option to specify which value to use for calculations, along with the name of the series being calculated.
The ErrorBarType Attribute
The ErrorBarType custom attribute defines how the lower and upper errors are calculated for the center values of the error bar series. Series center values can be populated using either data-binding, the series point collection, or using the ErrorBarSeries attribute. The value of the ErrorBarType custom attribute defines the type to use, and its parameters.
 Note Note |
|---|
| By default, no formula is assigned to any attribute, therefore the formula must be explicitly set. |
The following table outlines a list of formulas that you can use, along with a brief description of use.
|
Formula Name |
Parameter |
Description |
|
FixedValue |
Required |
This fixed value is a required parameter. |
|
Percentage |
Optional |
Errors are calculated as a percentage of the data point center value. If this parameter is not specified, a 10% margin of error will be used for upper and lower error values. |
|
StandardDeviation |
Optional |
Error values are determined by applying a Standard deviation calculation to the center values present in the error bar series. You can specify a number to use for the standard deviation. By default, if no value for this parameter is given, then a standard deviation value of 1 will be used. |
|
StandardError |
Optional |
Error values are found by applying Standard Error calculations to the center values in the error bar series. You can specify a number to use for the calculation of standard errors. By default, if no value for this parameter is given, then a standard error value of 1 will be used. |
|
Chart Details |
|
|
Number of Y values per point: |
3 |
|
Number of series: |
One |
|
Support markers: |
Yes |
|
Cannot be combined with: |
Doughnut, Pie, Bar |
|
Custom Attributes |
|
ErrorBarCenterMarkerStyle, PointWidth, ErrorBarSeries, ErrorBarType |
Chart Types
Chart Types Overview


