


Overview
The Funnel Chart type displays data that equals 100% when totalled. This type of chart is a single series chart representing the data as portions of 100%, and this chart does not use any axes.
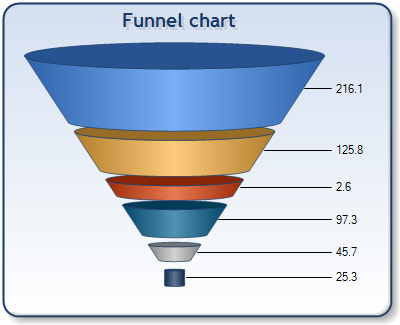
Figure 1: The Funnel chart can be displayed in 2D or 3D.
Using the FunnelStyle custom attribute, lets you draw the funnel using two different styles. This custom attribute lets you use the Y value to determine either the width, or the height of the funnel. Both of the X and Y values support linear, and logarithmic scales. However, by default the linear scales are used. Logarithmic scales are controlled using the axis Logarithmic, and LogarithmicBase properties.
 Note Note |
|---|
| Negative X and Y values are always treated as positive values. |
|
Chart Details |
|
|
Number of Y values per point: |
1 |
|
Number of series: |
1 |
|
Support markers: |
No |
|
Cannot be combined with: |
Any other chart types. |
|
Custom Attributes |
|
|
Gets or sets the funnel chart data point label style. |
|
|
Gets or sets the minimum height of the data point in relative coordinates. |
|
|
Gets or sets the 3D rotation angle for the funnel chart. |
|
|
Gets or sets the gap between the points in relative coordinates. |
|
|
Gets or sets the drawing style for 3D funnel charts. |
|
|
Gets or sets the vertical alignment of the data point labels when placed inside the funnel. |
|
|
Gets or sets the outside label placement relative to the funnel. |
|
|
Gets or sets the point label callout line color. |
|
|
Gets or sets the funnel chart style. |
|
|
Gets or sets the funnel neck width. |
|
|
Gets or sets the funnel neck height. |
|
 See Also
Chart Types
Chart Types Overview