


Overview
This formula returns the average, or mean, of data stored in a data series.
Applying the Formula
All statistical formulas are calculated using the Statistics class, and the following table describes how to use its Mean method to get an average.
| Value/Description | Example | |
|---|---|---|
| Formula Name: | Mean | Statistics.Mean ("Series1") |
| Parameters: |
|
Statistics.Mean("Series1") |
| Return: | A double that represents the average of all the data points in the given series. |
- |
 Note Note |
|---|
| Make sure that all data points have their XValue property set, and that their series' XValueIndexed property has been set to false. |
Statistical Interpretation
The average, or mean, is the sum of all values divided by the number of values.
Please note that it is the first Y value (Y1) of all data points that are used to calculate the mean.
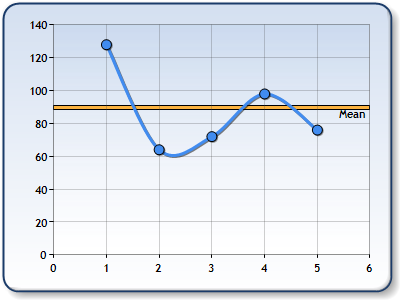 |
| Figure 1: A line type chart, with a Strip Line on the Y-axis representing the Mean. |
Example
This example demonstrates how to get the average of the data points in a series named "Series1". Note that the Y1 value of the data points is used.
| Visual Basic |  Copy Code Copy Code |
|---|---|
| |
| C# | Copy Code |
|---|---|
| |
 See Also
Formulas
Formulas Overview
Statistical Formulas
Using Statistical Formulas