


Overview
This article will help you get started with Dundas Chart for SharePoint™ with a minimal amount of effort. In this article you will be introduced to several procedures, and wizards that will help you work with the Dundas Chart for SharePoint™ web part.
Adding The Web Part To A Report
Adding the Dundas Chart for SharePoint™ web part to your reports is a fairly simple and straight forward procedure. Once you have created your blank report, follow these steps to add a new web part to it:
- If your page is not in edit mode, then choose Edit Page from the Site Actions menu shown in Figure 1 below.
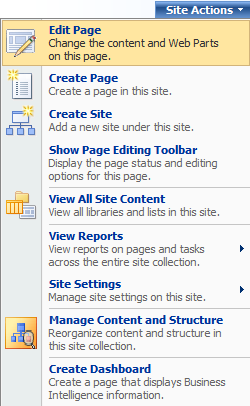
Figure 1: Choose Edit Page from the Site Actions menu.
- While in edit mode, click on the Add a Web Part header band, shown in Figure 2 below.

Figure 2: Click on the Add a Web Part header band.
-
Go to the Miscellaneous section, in the Add Web Parts dialog that comes up, and choose the Dundas Chart Web Part shown circled in red in Figure 3 below.

Figure 3: Use the Add Web Parts dialog to add the charting web part (shown circled in red) to your project. -
Click on the Add button to close this dialog, and add the charting web part to your report.
Adding A Data Source
The next step in using the charting web part is to connect it to a data source. To begin the data connection process, choose Wizards from the web part dropdown menu, then choose Connect To Data from the fly-out menu shown using the red arrow in Figure 4 below.
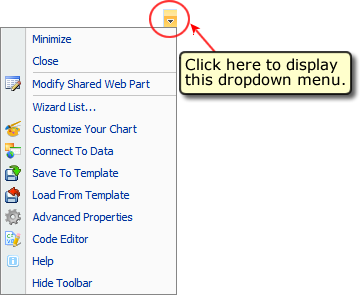 |
| Figure 4: Choose Connect To Data from the Wizards fly-out menu. |
The Data Connection Wizard dialog, shown in Figure 5 below, will open. Use Data Connection Wizard to choose an existing data source, and then data-bind it to your chart web part.
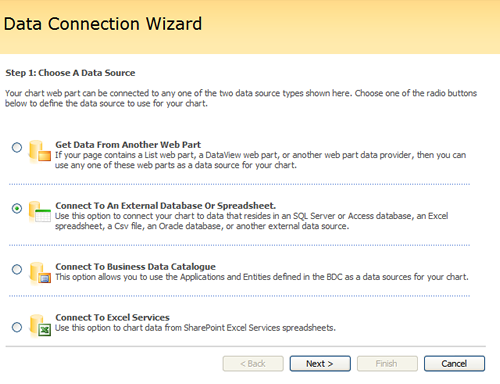
Figure 5: The data connection wizard.
There are various data sources to choose from in the Data Connection Wizard. These choices include:
- Get Data from Another Web Part.
- Connect To An External Database Or Spreadsheet.
- Connect To Business Data Catalogue.
- Connect To Excel Services.
Choose any one of the data sources above to use with your chart, and click on the Next button to proceed. Once you have completed all of the steps in the connection process, the wizard will automatically connect the chosen data source to your charting web part.