


Overview
A Radar chart, sometimes referred to as a Spider chart or Star chart, is a circular graph used primarily as a data comparison tool. These charts normally have a circular shape, but can also be displayed as a polygon.
Unlike most other chart types, the Radar chart does not plot an X Value. Radar Chart X Values are ignored for all Radar Chart series. However, even though X Values are ignored, the X Axis is still used for the labels around the chart, as well as spacings between the label, and the chart itself.
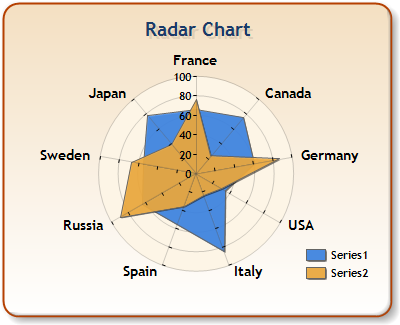
Figure 1: Radar Chart with a Circular shape.
The shape of the Radar Chart Area (which is the white area in the chart images) is determined by the custom attribute, AreaDrawingStyle. You can set the value of this custom attribute to one of two values including: Circle which is the default, or Polygon. The Circle shape is shown in Figure 1 above, and the Polygon shape is shown in Figure 2 below.
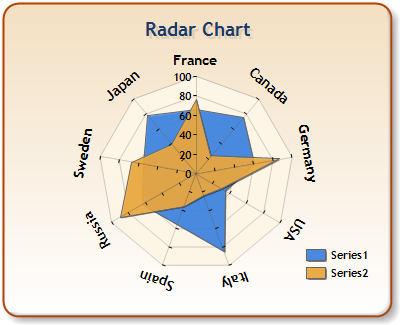
Figure 2: A polygon Radar chart using the Circular label style.
Example Setting the Drawing Style
Radar Chart Drawing Styles
There are three main styles used to draw the Radar chart. These styles are defined by RadarDrawingStyle custom attribute, which can be set to any one of the following three values including: Area, Line, and Marker. When a series of this type is drawn, you have control over the appearance of the series by using its series properties. This means that the series drawing styles such as Borders, and Markers may also be used. Use the standard properties of the series, and point object including the MarkerStyle, MarkerColor, BorderColor, CorderWidth properties to adjust the appearance.
|
RadarDrawingStyle |
Description |
|
Area |
Setting to this value will cause the chart to use the Horizontal style if the number of sectors is low, otherwise Radial will be used. |
|
Line |
Labels will be positioned in a circular fashion around the chart area. |
|
Marker |
The Label text will be drawn using the same angle as the radar sector. |
|
Horizontal |
The Label text will always be drawn horizontal. |
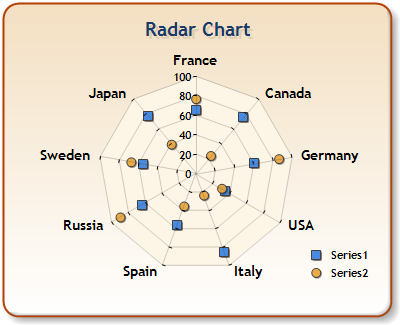
Figure 3: The marker style of Radar chart.
Radar Chart 3D Appearance
The Radar Circular chart area does not support real 3D. The only property from the Area3DStyle object that affects the Radar chart is the Enable3D property. By setting Enable3D to true, the drawing style of the area background changes to give the appearance of looking down on a 3D cone. No rotation, or any other 3D properties are applicable.

Figure 4: A 3D Radar chart.
Radar Chart Label Style
The displaying of labels around the Radar Chart is done using the CircularLabelsStyle custom attribute. Possible values for the CircularLabelsStyle attribute are shown in the table immediately following.
|
CircularLabelsStyle |
Description |
|
Auto |
Setting to this value will cause the chart to use the Horizontal style if the number of sectors is low, otherwise Radial will be used. |
|
Circular |
Labels will be positioned in a circular fashion around the chart area. |
|
Radial |
The Label text will be drawn using the same angle as the radar sector. |
|
Horizontal |
The Label text will always be drawn horizontal. |
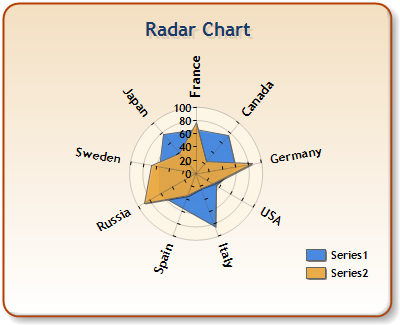
Figure 5: A Radar chart using radial label style.
The textual value for the axis labels can be explicitly set for the Radar chart using the AxisLabel property for each data point. Alternatively, custom axis labels may be defined using the CustomLabels collection of the X axis. If custom labels are set, they have higher priority over any other labels. When using custom axis labels, only the Text property of the custom label, and its index in the collection are important. The To and From properties are ignored.
The X axis object can also be used to control the distance between the chart area, and its circular labels by changing the X axis MajorTickmark.Size property.
Radar Chart Limitations
When using the Radar Chart, it is worthwhile to note that there is no support for StripLines, nor is there any support for Cursors, Zooming or Scrolling.
|
Chart Details |
|
|
Number of Y values per point: |
1 |
|
Number of series: |
One |
|
Support markers: |
Yes |
|
Cannot be combined with: |
Doughnut, Pie, Bar |
|
Custom Attributes |
 See Also
Chart Types
Chart Types Overview
Polar Chart