


Overview
Dundas Chart for SharePoint™ uses powerful technology to deliver unprecedented highlighting, scrolling, and zooming functionality to all of your web applications. Zooming and scrolling is made possible by using dataviews. These dataviews allow the charting web part to display a subset of its data for increased readability and analysis.
Zooming
To enable scrolling and zooming on a charting web part, follow these steps:
- Click the Advanced Properties link above the charting web part.
- Click Chart Areas in the navigation menu on the left-hand side.
- Locate and expand the CursorX and CursorY properties in the properties grid.
- Set the UserEnabled property of either cursor (or both cursors) to true as shown in Figure 1 below. This property enables interactive scrolling and zooming on the corresponding axis.
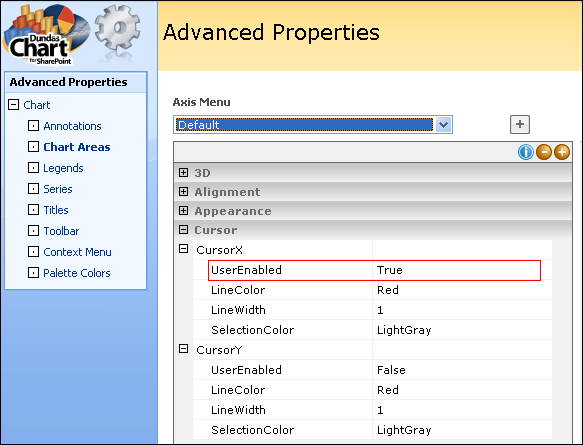 |
| Figure 1: The property grid for the default chart area. |
To actually zoom in on data, you must click within a chart area, and drag with the left-mouse button to highlight the area to be zoomed into as shown in Figure 2 below. The result of a zoom operation is the display of a view, along with any accompanying scrollbars.
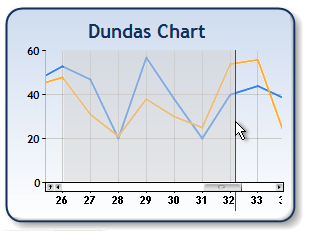 |
| Figure 2: Zooming in on the chart data. |
Every time you zoom in on data, the previous view is saved. You can zoom out to the previous view by clicking the Zoom Reset button at the left-end of a horizontal scrollbar (or the bottom-end of a vertical scrollbar).
Data Views
A data view is supported by the AxisDataView class, which is exposed via the Axis class' View property. A view has a Size, Position and SizeType which determines the subset of data that it displays.
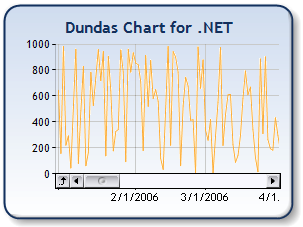 |
| Figure 3: Position and Size of a Data View. |
There are three different ways to display a view:
- By setting the Size, Position, and SizeType properties of an AxisDataView object directly.
- As a result of a zooming operation caused by the end-user clicking and dragging the left-mouse button.
- As a result of calling the overloaded Zoom method.
The MinSize property sets the minimum size of a view. This only affects end-user zooming (as opposed to zooming programmatically), and once the minimum size has been reached, the size of the view will not decrease; regardless of any further zooming by the end-user. By default, MinSize is not set (represented by the Double.NaN value), and the unit of measurement for MinSize is determined by the MinSizeType value.
When zooming occurs as a result of end-user interaction, the resulting size of a view may be limited, and depends on the View.MinSize property value set. If this property value is not set (i.e. has a value of Double.NaN) then no minimum view size will be used.
Programmatic zooming is accomplished using the overloaded Zoom method. The start and end axis positions of the new view may be specified, or the position and size of a view can be specified. Also, the size and position of the current view can optionally be saved before displaying zooming.
Resetting A Data View
A data view can be reset either by an end-user, or at runtime programmatically. Every time an end-user zooms in on data, the previous view is saved. When the end-user clicks on the ZoomReset button, the previous view is displayed. When zooming in on data, using the overloaded Zoom method, it is up to you to save the previous view (depending on the Zoom definition used). When resetting a view, using the overloaded ZoomReset method, any of the saved views can be displayed; including the originally displayed data (i.e. no zooming).
Axis Values and Margins
To retrieve the maximum and minimum axis values of a view, use the GetViewMaximum and GetViewMinimum methods.
If Axis.Margin is set to true, then margins will be displayed. However, axis margins will affect what is displayed in your data views.
Scrolling
Scrolling can occur either interactively (i.e., the end-user moves a scrollbar) or programmatically by calling the overloaded Scroll method.
When the end-user clicks on a scrollbar's up/down or right/left button, the chart image will scroll by one pixel. When the end-user clicks on the background of a scrollbar (i.e. not on the thumb, but beside the thumb), the scrolling size is represented by the Size property. Since zooming results in a smaller size of view being displayed, the "scrolling size" decreases after each zoom. To limit this behavior, use the MinSize property to set a minimum scrolling size.
Call the Scroll method when scrolling programmatically. Scrolling does not change the size of a view, rather, it changes the position of a view. When calling the Scroll method, the developer has the option of scrolling to a specified location along an axis, using a definition that takes a newPosition parameter.
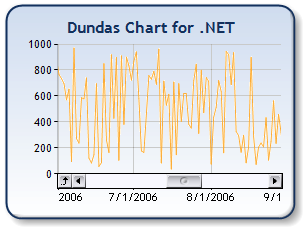 |
| Figure 4: Result after scrolling the chart in Figure 3. |
Scrollbars
Scrollbars are represented by the AxisScrollBar class, which is exposed via the Axis.ScrollBar property. The AxisScrollBar class controls the appearance of scrollbars, and lets you set such things as the color of arrows and symbols via the LineColor property, the background color of the scrollbar via the BackColor property, and which buttons are displayed (e.g. zoom reset button, left/right and up/down buttons, etc.) via the Buttons property. AxisScrollBar can also be used to enable or disable a scrollbar through the Enabled property. However, even if a scrollbar is enabled it may not be visible since it will only be displayed if its corresponding axis is showing an associated data view.
Labeling
Here are some suggestions when setting axis labels in conjunction with the scrolling and zooming feature:
- It is advised to set the LabelsAutoFit to true. If this property is false, the labels will be fixed in size, and changing the axis view may cause labels to be cut off.
- It is advised to set the InnerPlotPosition property to Auto. Setting the inner plot position to a fixed size may cause labels to overlap.
- The Chart will disable anti-aliasing if you have specified a transparent value for the chart background. We advise you to avoid gradients or setting alpha values when drawing the chart area background.
Some Points to Consider
The following are some points to note when using the scrolling and zooming features:
- Chart elements that are placed inside the chart area will not be re-drawn when scrolling or zooming.
- You may experience unpredictable behavior when enabling SmartLabels™.
- In situations where there are large differences between axis label lengths, we advise that you set the inner chart area position to a fixed value.
Scrolling and zooming are not supported when using the following Chart-related features:
- Non-linear chart types (pie, doughnut, radar, etc.).
- 3-D charts.
- Labels auto fitting.
- Secondary axes.