Overview
The chart area is a major element of the entire chart image. This element contains a plotting area, axis labels, axis titles, and more. The plotting area is found inside the chart area, and contains: axes, chart types, grid lines, strip lines, and any other components of the chart image. Axis labels are always outside of the plotting area, but most other elements are found within the plotting area.
 Note Note |
|---|
| Pie and Doughnut charts do not have, or use, axis labels, axes, grid lines, tick marks, or strip lines. |
Chart Area Size and Position Properties
The InnerPlotPosition property is used to change the size of the chart's plotting area. This property is particularly useful when you want to change the size of your pie or doughnut charts within a ChartArea object.
One chart image can support multiple chart areas, as shown in Figure 1 below.
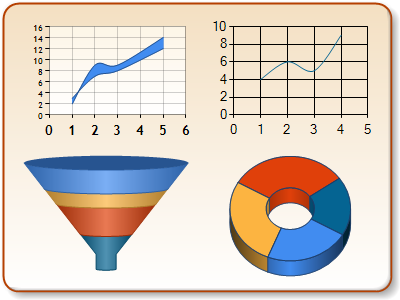
Figure 1: Four chart areas in one chart image.
Chart Area Position
You can use the layout manager to automatically set the position of a ChartArea object. You can also explicitly set the position of a ChartArea object by setting its Position property. By default, the layout manager automatically sets the position of a chart area, and will take into account the number of chart areas to be plotted, the chart image title position, and the legend's position as well.
The Position property, as shown in Figure 2 below, is a design-time property that is used to set the position of the Chart Area within the entire chart image .
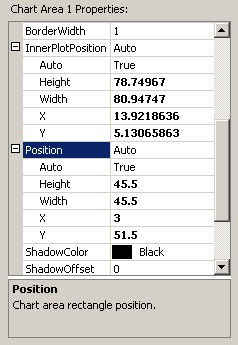
Figure 2: ChartArea object's position property.
The Position object's properties include:
-
Auto, which is a Boolean property. If set to true, the Chart control will automatically place the chart area within the chart image.
-
X (0-100%). This value defines the x-coordinate of the upper left-corner of the ChartArea object within the chart image, and is measured as a percentage of the overall chart image's width. For more information on the coordinate system, see the topic on Chart Coordinate System.
-
Y (0-100%). This value defines the y-coordinate of the upper left-corner of the ChartArea object within the chart image, and is measured as a percentage of the overall chart image's height. For more information on the coordinate system, see the topic on Chart Coordinate System.
-
Height (0-100%). This value defines the height of the chart area as a percentage of the overall height of the chart image.
-
Width (0-100%). This value defines the width of the chart area as a percentage of the overall width of the chart image.
By default, the layout manager will not allow chart areas to overlap, however, by setting the positions manually it is possible to override this behavior. Determining the z-order (the chart area that will be upper most when viewed) of the chart areas can be set by using the ChartAreaCollection object. Each chart area may be ordered using the up and down arrow buttons seen in Figure 3 below.
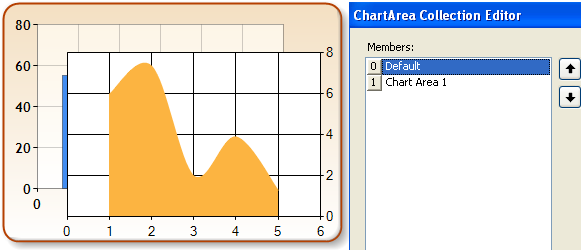
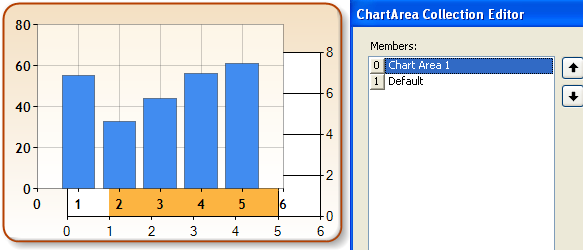
Figure 3: Use the up and down arrows to set the chart's z-order.
 Note Note |
|---|
| When ChartArea objects overlap, you can achieve interesting results by specifying transparent background colors. |
Inner Plotting Area Position
The InnerPlotPosition property represents the plotting area of a ChartArea object. This property uses coordinates that are relative to its ChartArea object, whose coordinates are set by the Position property, and are relative to the chart image. For example, if the chart area's X position is set to 10%, and the plotting area's X Position is set to 15%, then it would be incorrect to assume the plotting area's X position, from the border of the chart image, will be 25% of the chart image's width. The X position value of the inner plot position would be 15% of the ChartArea object's width, whereas the x-position of that ChartArea object would be 10% of the chart image's width.
The position of the plotting area inside the chart area also depends on axis labels. If there is not enough space for the labels, the layout manager will automatically decrease the size of the plotting area. The InnerPlotPosition property can also be used to change the size of pie and doughnut chart types within a ChartArea object.
Chart Area Alignment
If you use multiple Chart Areas, then use the Position property to align your charts. To achieve the desired effect often involves several iterations of trial and error. Even then, the alignments may be right in some circumstances, but become misaligned in other cases due to abnormally large axis labels. For this reason, we have introduced a set of properties that will handle the alignment correctly for all situations, and it is the recommended means of chart area alignment.
The following table outlines the alignment properties, and gives a short description of each.
|
Property |
Description |
|
AlignWithChartArea |
Specifies the master chart area name to which this chart area should be aligned |
|
AlignOrientation |
Defines the alignment to use: vertical, horizontal or both |
|
AlignType |
Defines the elements of the chart area that should be used to set the alignment. The possible values are:
|
By using the ChartArea AlignWithChartArea, AlignOrientation, and AlignType properties, you can align or synchronize two or more chart areas horizontally, vertically, or both.
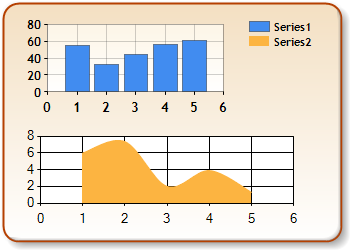
Figure 4: Non-aligned chart areas.
In Figure 4, there are two chart areas with different magnitudes of Y Values. The larger values in the upper chart area require more space for the axis labels to be displayed. By default, when using multiple chart areas, they are aligned but the inner plot position is affected by the real-estate required by the other chart elements. The result is that the rendered chart may be misaligned as in the case demonstrated.
A better representation of the chart is shown below in Figure 5 after setting only one property of the second chart area, AlignWithChartArea=Default. This property aligned the chart areas based on the default AlignType, All (however, using PlotPosition would have been a sufficient AlignType).
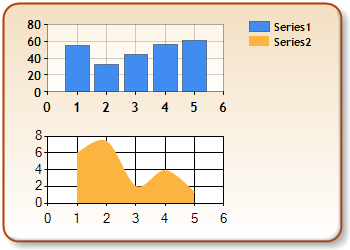
Figure 5: Aligned chart areas.


