


Overview
Dundas Chart for Windows Forms allows you to set options for interacting with the chart. You can add cursors, highlight ranges, scroll through important data and zoom in on key information present on the chart. Both range selections and cursors are associated with an axis inside a chart area (see the figures below).
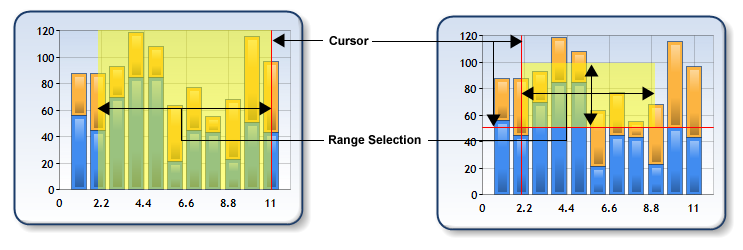 |
| Figure 1: Range Selection and Cursor for X Axis (left), and Range Selection and Cursors along both axes (right). |
How Cursors and Range Selections are Implemented
Both cursors and range selections are implemented by the Cursor class, which is exposed as the CursorX and CursorY properties of the ChartArea object. The CursorX object is for the X axis of a chart area, and the CursorY object is for the Y axis. The AxisType property of these objects determines if the associated axis is primary or secondary
The only cursor and range selection functionality outside of the Cursor class are the cursor and range selection related events of the root Chart object (see the Cursor and Range Selection Events section below for further details).
There are two ways that cursors and range selections can be displayed: via end-user interaction and programmatically. Both of these methods are described below in detail.
Appearance Properties of Cursors and Range Selections
The color, width and style (e.g. dotted, dashed, etc.) of a cursor is determined by the LineColor, LineWidth and LineStyle properties, respectively.
The only appearance property of a selected range is its color, which is determined by the SelectionColor property. This can be any valid ARGB color, and if an alpha value is not provided (which determines the level of transparency) then a default alpha value of 120 is used. We recommend using a semi-transparent color so that the underlying data, etc. is still visible.
Example
The following example sets the appearance properties for the cursor. This example assumes, that within the chart there is a Chart Area named default.
| Visual Basic |  Copy Code Copy Code |
|---|---|
| |
| C# | Copy Code |
|---|---|
| |
User-interaction, Cursors and Range Selection
End-users can display a cursor by clicking inside of a chart area and/or select a range of data by clicking and dragging the mouse.
The cursor user-interface is enabled by setting UserEnabled to TRUE, and when enabled the end-user can display a cursor by left-clicking within a chart area.
The location where a cursor is drawn is determined by the Interval, IntervalOffset, IntervalType and IntervalOffsetType properties. If Interval is zero (the default) then a cursor can be displayed anywhere within the chart area. If Interval is set to a non-zero value than cursors are drawn in "step mode", with the "steps" being determined by the four previously mentioned interval-related properties (see the sample code below for an example using these properties). If the Interval property is not zero then the position at which a cursor is drawn will be the nearest allowable position (e.g. if the Interval is 0.5, and the end-user clicks at 0.6 then the cursor will be drawn at 0.5).
The range selection user-interface is enabled by setting the UserSelection property to TRUE, and range selection occurs when the end-user left-clicks within a chart area and drags the mouse. Note that the interval-related properties affect the start and end ranges of the selection in the same manner as the cursor position described in the preceding paragraph.
User-interaction will result in the cursor and range selection events being fired.
To implement range selection and/or cursors with the middle or right mouse buttons, or the keyboard, override the appropriate event and use the SetCursorPixelPosition and/or SetSelectionPixelPosition methods. For an example of this see the SetSelectionPixelPosition topic.
 Caution Caution |
|---|
| If the Zoomable property of an axis' View property is set to TRUE then range selection along that axis will result in zooming. For information on zooming and data views see the Scrolling and Zooming topic . |
Example
The following example sets the X axis cursor for a chart area named "Default" so that cursors, as well as the beginning and end points of range selections, can only occur on Saturdays. We will assume that there is one data point being plotted per day, and that the X axis value type of the series being plotted is DateTime (e.g. Series.XValueType=ChartValueTypes.DateTime).
| Visual Basic | Copy Code |
|---|---|
| |
| C# | Copy Code |
|---|---|
| |
Setting Range and Cursor Positions Programmatically
Cursor positions can be set programmatically using the Position property, as well as the SetCursorPosition and SetCursorPixelPosition methods. SetCursorPosition and Position use an axis value for the position, while SetCursorPixelPosition uses a position in pixels with the point 0,0 being the top-left corner of the entire chart image, and NOT the relevant chart area (for this reason SetCursorPixelPosition is especially useful when positioning a cursor inside a mouse-related event).
The beginning and end positions of a range selection can be set programmatically using the SelectionStart and SelectionEnd properties, as well as the SetSelectionPosition and SetSelectionPixelPosition methods. SetSelectionPosition, SelectionStart and SelectionEnd use an axis value for the position(s), while SetSelectionPixelPosition uses positions in pixels with the point 0,0 being the top-left corner of the entire chart image, and NOT the relevant chart area (for this reason SetSelectionPixelPosition is especially useful when positioning a range selection inside a mouse-related event).
 Note Note |
|---|
| Note that the interval-related cursor properties (e.g. Interval) have no effect when setting a cursor or selection position or using code. Also, the cursor and range selection related events will not fire when set via code. |
To invalidate and redraw the cursors and range selections in the chart (for all chart areas) use the UpdateCursor method.
Example
The following example sets the selected range for both the X and Y axes, and uses user input via text boxes for the start and end positions of the ranges.
| Visual Basic | Copy Code |
|---|---|
| |
| C# | Copy Code |
|---|---|
| |
Cursor and Range Selection Events
There are four events that are raised as a result of user-interaction: CursorPositionChanged, CursorPositionChanging, SelectionRangeChanged, and SelectionRangeChanging. The CursorPositionChanging event can be used to restrict the position of a cursor, while SelectionRangeChanging can be used to restrict the beginning and end points of a range selection.
CursorPositionChanged and SelectionRangeChanged can be used to take some action after a cursor or range selection has been set by an end-user.
All of these events have a CursorEventArgs parameter object, which can be used to:
- determine the ChartArea object the event was raised for.
- determine the Axis object the event was raised for.
- get (and in the case of the "changing" events set) new positions and beginning/end points of range selections.
| Note |
|---|
| If a CursorEventArgs property is Double.NaN then the property is disabled, and not relevant to the event (CursorEventArgs is used for both the selection and cursor events). For example, the NewPosition property will be Double.NaN for the SelectionRangeChanged and SelectionRangeChanging events, since NewPosition only applies to the two cursor-related events. |
Example
In this example we limit the end of the selected range along the X axis for the chart area named "Chart Area 1". We assume that the X axis values are 1, 2, 3, etc., and the user isn't allowed to select a range past an axis value of 3.
| Visual Basic | Copy Code |
|---|---|
| |
| C# | Copy Code |
|---|---|
| |