Overview
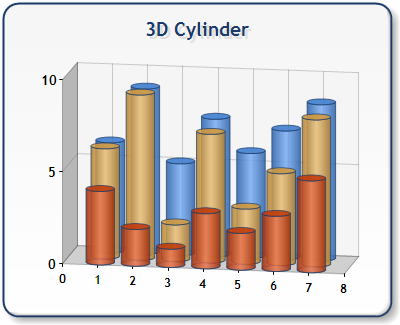
All 3D bar and column-type charts (including the Gantt chart) can be displayed using a cylindrical shape for their data points, and these cylinders can be applied to either an entire data series or to specific data points within a series.

Figure 1: A Cylinder chart shown in 3D mode.
Cylinder charts are not a chart type in themselves, rather a "cylinder chart" is another chart type that displays cylindrical data points by using the DrawingStyle custom attribute.
 |
The 3D Cylinder chart cannot be rendered using a Flash image type. |
For more information see the topic on Creating Cylinder-Type Charts.
Chart Types
Chart Types Overview
How To
Working with 3D Charts


