


Overview

Gantt charts, or Time charts, display separate events that have beginning and end values. These charts are excellent for planning the use of resources, and data can be plotted using a date-time scale or a numerical scale.
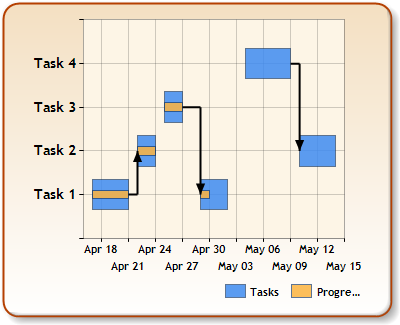
Figure 1: A Gantt chart.
Multiple data sets are represented as series, and each series can represent one or more tasks. It is worthy to note that, data labels cannot be drawn outside the bars (i.e. setting the BarLabelStyle custom attribute to "Outside" has no effect).
|
Chart Details |
|
|---|---|
|
Number of Y values per point: |
2 |
|
Number of series: |
One or more. |
|
Support markers: |
Yes |
|
Cannot be combined with: |
Any chart type except bar-type charts |
|
Custom Attributes |
|---|
|
PointWidth, BarLabelStyle, DrawingStyle (e.g. cylinders) |
 See Also
Chart Types
Chart Types Overview