Gets or sets a value that determines if the data points of a series will use their indices for X-values.
Indicates that a data point index (1,2,...) will be used for the X value.
| Visual Basic (Declaration) | |
|---|---|
Public Property XValueIndexed As Boolean | |
| Visual Basic (Usage) |  Copy Code Copy Code |
|---|---|
| |
| C# | |
|---|---|
public bool XValueIndexed {get; set;} | |
Return Value
If true then all data points belonging to the series will use their indices for X-values. If false they will not. Defaults to false.
All data points in a series use sequential indices, and if this property is true then data points will be plotted sequentially, regardless of their associated X-values. This means that there will be no "missing" data points.
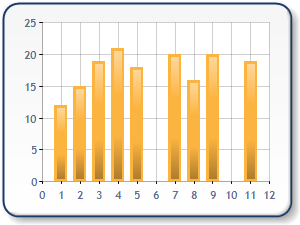
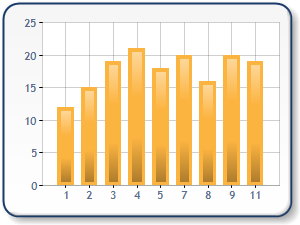
For example, assume there are three (3) data points in a series having X-values of 1, 2 and 4. If this property was false then there would be a data point missing at the X-axis location labelled "3" (see diagram below). However, setting this property to true will then result in the three data points being plotted at points 1, 2, and 4 sequentially, and there will be no missing data point (see diagram below).


Figure 1: XValueIndexed = False to left, and XValueIndexed = True to the right.
This is useful when you do not want to have missing data points for intervals that you know you will not have data for (e.g. weekends).
IMPORTANT: If you are displaying multiple series and at least one series is using indexed X-values then ALL series must be aligned (i.e. have the same number of data points, with corresponding points having the same X-values). For further details see the Aligning Series topic.
Target Platforms: Windows 98, Windows NT 4.0, Windows Millennium Edition, Windows 2000, Windows XP Home Edition, Windows XP Professional, Windows Server 2003 family, Windows Vista, Windows Server 2008 family


