How to use FusionCharts in PowerPoint?
In this section, we'll actually use FusionCharts in PowerPoint presentations.
To use FusionCharts in PowerPoint presentation, you need to keep a central location for your presentation containing the charts. This location reference shouldn't change even if the presentation is transferred from one machine to another. For e.g., if you're building the presentation in C:\Presentations\MyNewPresentation on Machine 1, the path should stay the same on Machine 2 too, if you want to port the presentation.
This is because Shockwave Object uses absolute reference for path of SWF objects.
For our example, we'll create a new folder C:\Presentations\Sales2006.
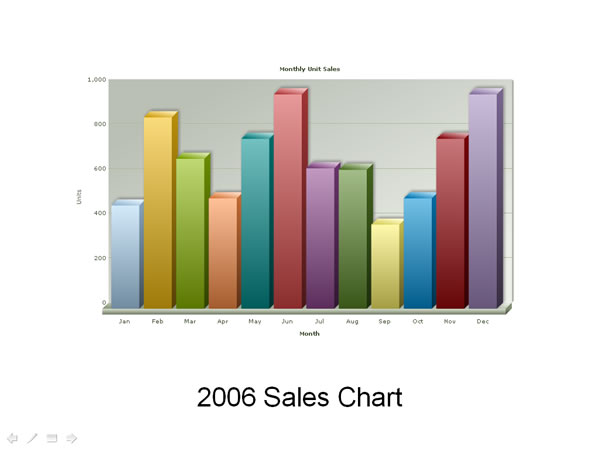
Now, that you're prepared for the roll, you need to build the XML data for the chart, as FusionCharts accepts only XML data. Create a file named as Data.xml (strictly Data.xml) with the following XML and save it in the same folder (C:\Presentations\Sales2006). If you're unsure about FusionCharts XML, please see the "FusionCharts and XML" section in this documentation.
<set label='Jan' value='462' />
<set label='Feb' value='857' />
<set label='Mar' value='671' />
<set label='Apr' value='494' />
<set label='May' value='761' />
<set label='Jun' value='960' />
<set label='Jul' value='629' />
<set label='Aug' value='622' />
<set label='Sep' value='376' />
<set label='Oct' value='494' />
<set label='Nov' value='761' />
<set label='Dec' value='960' />
</graph>
Now we get to the main part where we create the actual presentation. Create a new Presentation and save it as Sales2006Presentation.ppt and save it in the same folder (strictly required).
For the sake of simplicity, we'll embed the chart in the first slide itself. Before that, let's add a label to the first slide and name it as "2006 Sales Chart" as under:
Select "Shockwave Flash Object" from this menu. There may be other "Flash" or "Shockwave" related components on your machine. It is imperative that you choose this object. Otherwise, the embed will not work.
Your cursor will now change to a crosshair. Create a rectangle on the slide by dragging the cursor. This rectangle would be the span of the control - i.e., the chart would appear within this control. So, make the box of the size you want the chart to be. This can be full-screen or a portion of the screen. You'll see a cross being generated on your slide (as under):
As you might already be feeling, most of the options here are pretty familiar. The first textbox asks you to punch in URL of the chart SWF. Here, you'll need to hard-code the full path of the .swf file. Even though we've the .swf file in the same folder as the .ppt file, we'll still need to give the full path (c:\...\...\chart.swf). You need to put this only as Movie URL and NOT Base URL.
Since we're using default Data.xml file for this example, so we do not need to provide any dataURL for this example. FusionCharts will automatically read XML data from Data.xml present in same folder.
Select the other properties and click on Ok.
Now, when you come back to the Properties window, you'll see the Playing property is set to False. You'll need to set it to true for the chart to appear and animated, during the slide show. Also, when you close this presentation and re-open it, you'll again find that this property has been set to False by Powerpoint. So, though irritating, you'll need to set this property back to true each time you open the .ppt file.
Also, set the intended width and height of the chart in this dialog box itself.
Finally, save and run your slide show in presentation view. You'll see the chart as under. If the chart doesn't show up, right click on the place where the chart is supposed to be and select Play from the context menu.