Multi-level Pie Chart > Overview
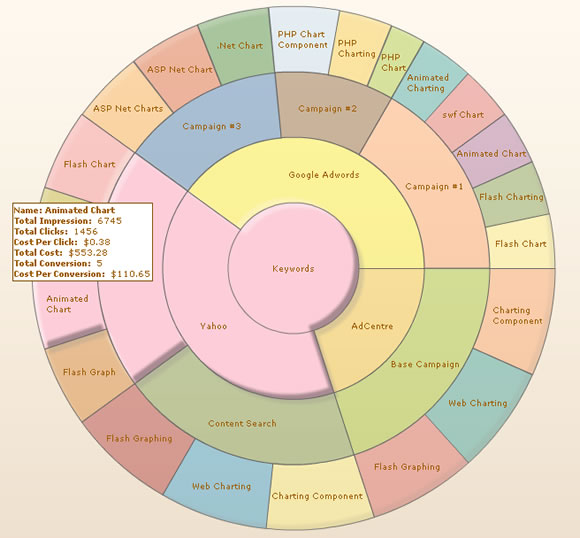
The multi-level pie chart is a special type of chart that allows you to show symmetrical and asymmetrical tree structures in a consolidated pie like structure. The advantage of using this chart over a tree view is that you can give a single screen snapshot of the entire data to be presented. Also, the pies can assume numerical values and thereby divide the visual segments ratio based on the numerical values. The chart offers advanced interactivity options like visual path tracing from any child to parent and so on.
This chart be used to show various types of data like:
- Organization structures
- Multi-tiered data presentation like keyword analysis
- Inter-linked tree data like friends of friends etc.
Shown below are a few examples: