Documentation Index
Starting
Starting the
Console
How to start the console depends on the operating system you are
using:
- Windows
Locate the PureLoad sub menu in the Start menu and select the PureLoad Console entry in
the sub menu.
- Linux/Unix
Open a shell and change directory to the PureLoad installation
directory. Execute the bin/console
program.
- Mac OS X
Double click on the console application.
Starting in Stand-alone
Mode
Runnig PureLoad in stand-alone
mode, means that all required server processes are started for you
together with the console. This is useful when you want to test or
run a small test on one host only. Normally you run PureLoad in a
distributed environment (see ) where server processes are running
on separate hosts.
How to start in stand-a-lone mode, depends on the operating
system you are using:
- Windows
Locate the PureLoad sub menu in the Start menu and select the PureLoad Standalone entry in
the sub menu.
- Linux/Unix/Mac OS X
Open a shell and change directory to the PureLoad installation
directory. Execute the bin/standalone
program.
The Console
The PureLoad Console is the central point of control when
managing a load session and executing a load test. It is used to
assign workers and worker threads, design scenarios and evaluate
the output from a load session. The console is designed to be
intuitive and easy to use. Its layout using tabs ("folders")
guides a tester from setting up the execution environment,
defining the scenario of tasks that shall be executed, to the
final stage where the actual results can be analyzed.
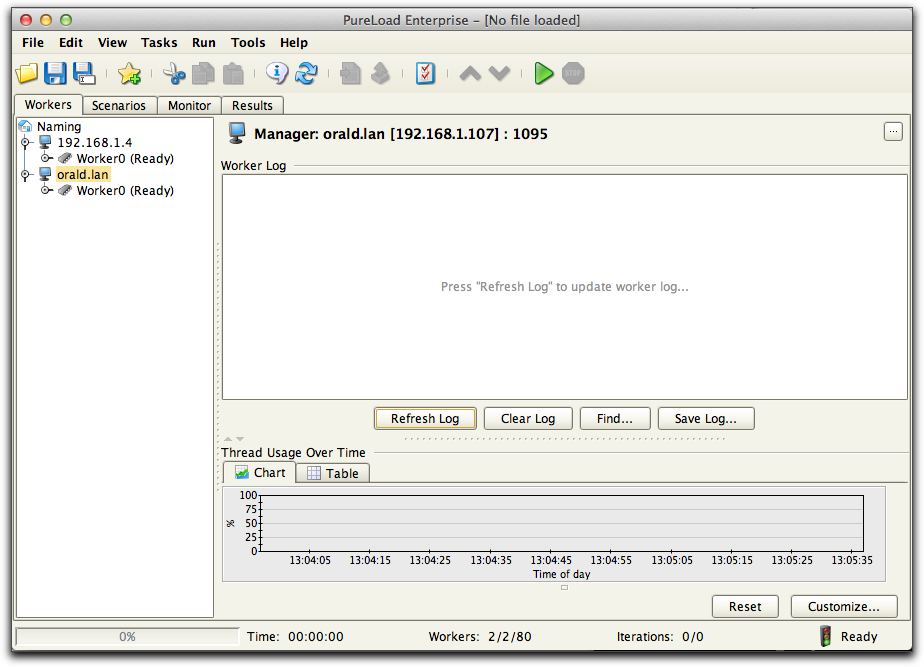
There are four main tabs:
- Workers
- Used to define the resources used to generate the load -
workers and worker threads that are used during load test
execution.
- Scenarios
- Used to edit the scenarios that will be part of the load test.
This is where tasks are parameterized and any data driven tests
are defined using Task Parameter Generators.
- Monitor
- Used to define server monitoring.
- Results
- Results collected during a load test are reported in this tab.
Results can be analyzed using different views.
Menu Bar
The menu bar groups all operations in menus. Most of them are
context sensitive and are enabled depending on the current state
in the console.
- File Menu
- The file menu includes operations to load and save PLC
(PureLoad Configuration) files, to export results to files and
to connect and disconnect from the naming server.
- Edit Menu
- The edit menu includes operations to alter the current
context. I.e cut/copy/paste objects, create new objects and to
reorganize object. Objects here differs from the current
context; if you are in the Workers tab objects are worker or
worker threads, if you are in the Scenarios tab object are
scenarios, sequences or tasks.
- View Menu
- The view menu is used to view properties, reload data, show
debug info etc.
- Task Menu
- The task menu is used for operations on tasks, not included in
edit or view menu.
- Run Menu
- The Run menu is use to control execution. I.e start and stop a
load test.
- Tools menu
- Use the Tools menu to start the tools included: HTTP Recorder,
Web Crawler or Result Comparer.
- Help Menu
- The help menu includes functions to browse PureLoad
documentation and related information.
Tool Bar

The tool bar contains a subset of the menu bar operations that
are frequently used. These buttons are context sensitive and
generally adapts the behavior (functionality) according to the
current state. (I.e. the Create Object button  ,
creates a worker when the worker tab is current and it will create
a scenario object when the scenario tab is current).
,
creates a worker when the worker tab is current and it will create
a scenario object when the scenario tab is current).
Status Bar
The status bar shows details about the load session and the
execution state.

The No of Workers show
number of managers, number of workers and number of threads,
separated with a slash. No of
scenarios also shows total number of scenarios and total
number of tasks.
Tool Properties
The Tool Properties dialog is displayed by selecting the
File->Properties menu choice or the  button in the tool bar. This dialog is used to control various
settings that are saved to a file on disk between invocations of
the PureLoad Console.
button in the tool bar. This dialog is used to control various
settings that are saved to a file on disk between invocations of
the PureLoad Console.
General
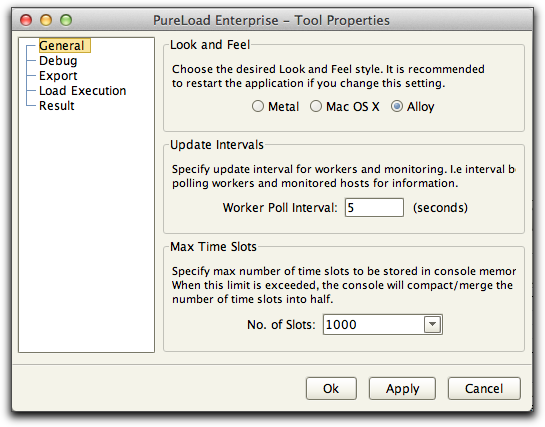
The general properties are:
- Look and Feel
- Look and Feel of the user interface. Not all options may be
valid on your platform. I modified the console must be restarted
for all Look and Feel settings to be applied.
- Update Intervals
- Indicates in seconds how often the PureLoad Console should
automatically be updated during execution. If you are using many
managers you should increase this to minimize the load this
might have on network traffic. Default is 20 seconds.
- Max Time Slots
- Max number of time slots in results, showing results over
time. When/if exceeded, the console will compact/merge the
iformation. This setting is used to save memory for longer
execution sessions. If you increase this value also make sure
you have enough memory defined for the console.
Debug
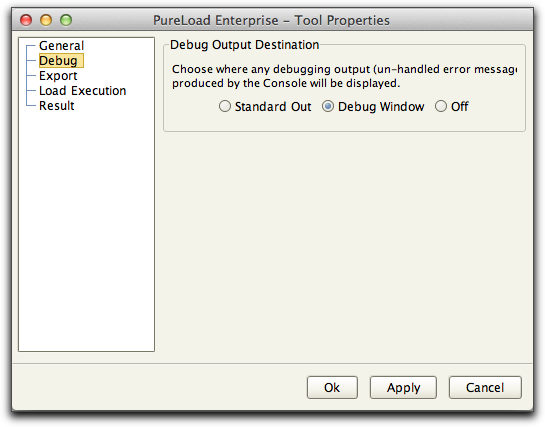
Normally and the recommended setting is to use the default
setting Debug Window to
allow debug information and error messages being displayed in the
debug window.
If started from shell (Unix) Standard
Out can be useful.
Export
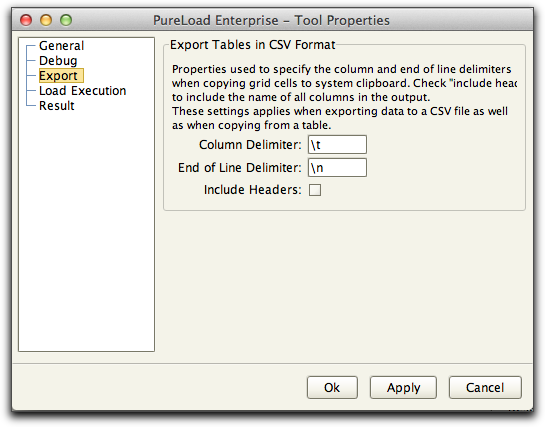
The following export properties exists:
- Column Delimiter
- The column delimiter to be used for export of table data in
CSV (Character Separated Values) format. Default is tab (\t).
- End of Line Delimiter
- The end of line delimiter to be used for export of table data
in CSV format. Default is (\n).
- Include Headers
- Include column headers in the export.
Load Execution
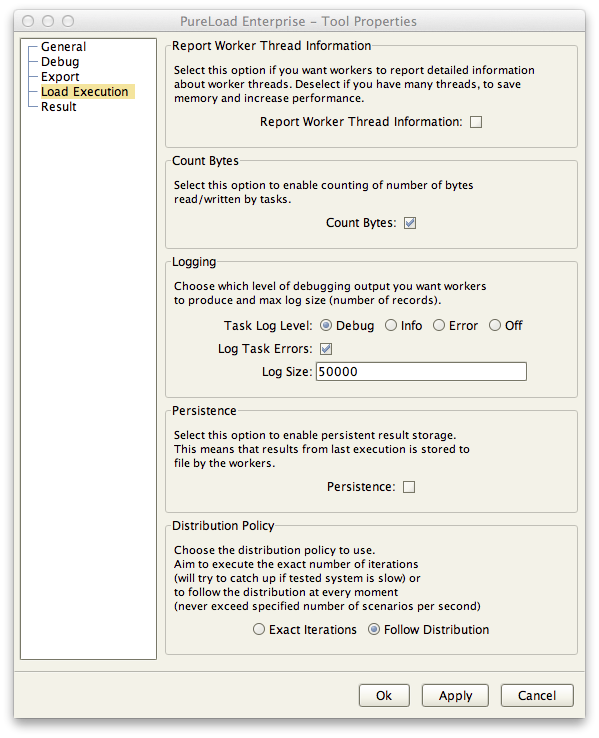
The following export properties exists:
- Report Worker Thread
Information
- If checked (default), information about each thread will be
displayed and reported. De-select this if you have many (more
than 1000) worker threads to improve performance.
- Count Bytes
- If checked, the worker will count the number of bytes
transferred.
- Logging, Log Level
- Specify the detail level of the worker log during a load test.
- Logging, Log Size
- Specify here the size in lines of the worker log until it is
wrapped.
- Logging, Log Task Errors
- Specifies if task errors should be logged on ERROR level.
- Persistence
- If checked the workers will persistently store results as
execution is carried out. Saves result for last execution only.
- Distribution Policy
- Specify the Distribution Policy to use. Exact Iterations aims
to execute exact number of iterations (will try to catch up if
tested system is slow) or to follow the distribution at every
moment (never exceed specified number of scenarios per second).
Results
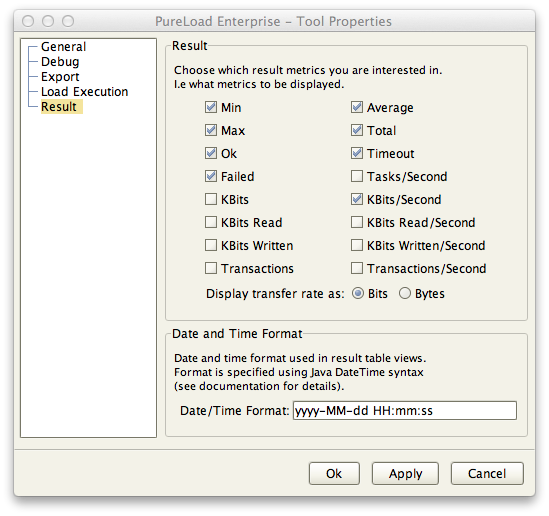
The properties controls which result metrics to show in the
Results main tab. The property 'Display transfer rate as' controls
the way transfer rates are reported.
In addition the date and time format used can be specified. The
format is specified using Java SimpleDateFormat
format. Example of valid format strings:
- yyyy-MM-dd HH:mm:ss (default)
- yyyy-MM-dd'T'HH:mm:ss (ISO 8601)
- yyyy-MM-dd'T'HH:mm:ssZ (ISO 8601 with timezone offset)
Copyright � 2015 Minq
Software AB. All rights reserved.