Server Monitoring
January 2015
support@pureload.com
Server Monitoring
|
|
| PureLoad
5.2 January 2015 |
http://www.pureload.com support@pureload.com |
PureLoad supports monitoring of servers during a test. Server
monitoring is defined by using Monitors, per server hosts to be
monitored, by defining what resources (or resource counters) to be used
per monitor.
SNMP can be used to monitor SNMP compliant devices and systems.
Monitoring of UNIX based servers are based on SSH and agent-less, meaning that no
software has to be installed on the servers to be monitored. Monitoring
of Windows based servers requires an agent to be installed on the
server to be monitored.
Note: Server Monitoring is only available in the
Enterprise Edition.
A UNIX based system to be tested must have SSH
enabled and support SSH2 with either "password" or
"keyboard-interactive" authentication. This is normally supported by
default on
most UNIX based systems.
You should verify SSH client-to-server connectivity from the command line outside of PureLoad before setting up monitors in PureLoad. For example, the following command line requests a ssh connection using SSH2 to remote host:
% ssh -2 remotehost
This normally will return text information that indicates the version of SSH protocol that is being used. Also, this will attempt to authenticate as the current user. Use the -l username switch to request a login as a different user.
Once you have confirmed SSH connectivity, create and test Monitor
settings in PureLoad.
To test a Windows based server system an agent is required. The agent
used is an Open Source product NSClient++.
For details
on how to download and install the agent software, see the Installing NSClient++ section below.
The monitor view is used to control what servers are being monitored
(a Collector) and what resources that is monitored per collector. The
monitor view is enabled by selecting the appropriate tab in the console:
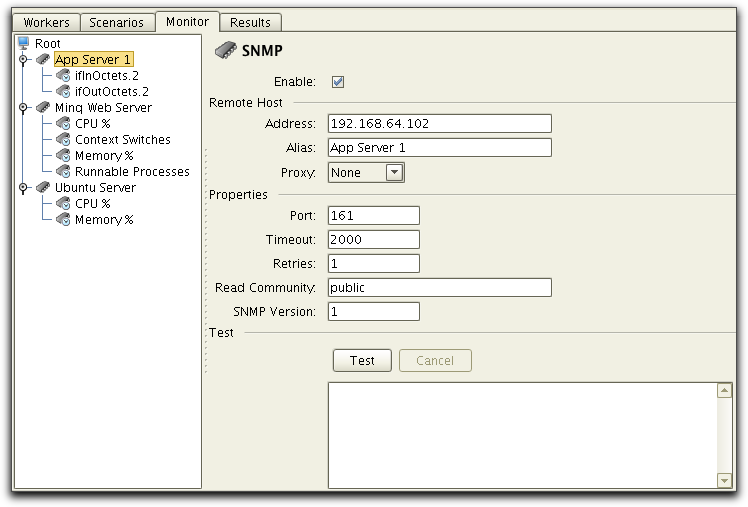
The tree to the left shows the following type of objects:
The view to the right shows and allows setting of properties for the selected object.
To add a new server to be monitored, select the root object and
choose the Edit->Create
menu option or
the  button in the tool bar. A list of
collectors are presented in a dialog:
button in the tool bar. A list of
collectors are presented in a dialog:
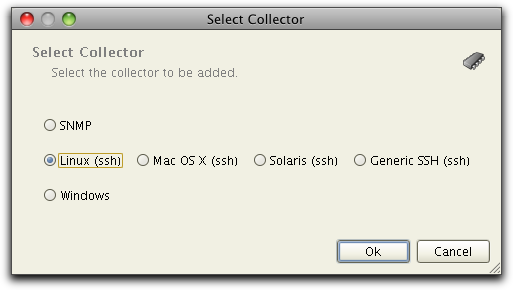
Select the collector type that best matches the OS of the server you
want to monitor. The added collector is now presented in the tree and
the properties for the collector is displayed.
The setting for the collector is displayed when you select the
collector in the tree. The settings varies depending on the type of
collector. The following figure shows the SNMP collector configuration.
The collector properties are:
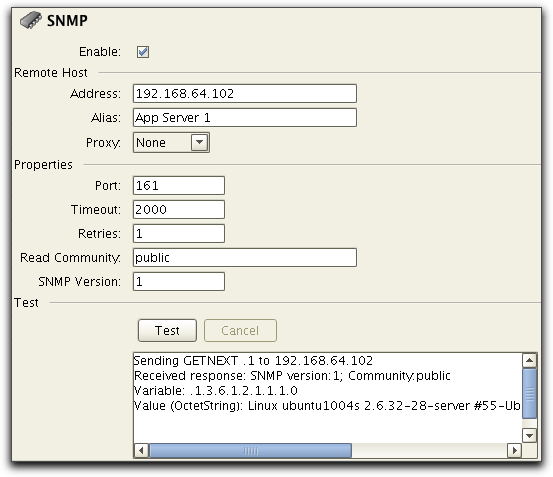
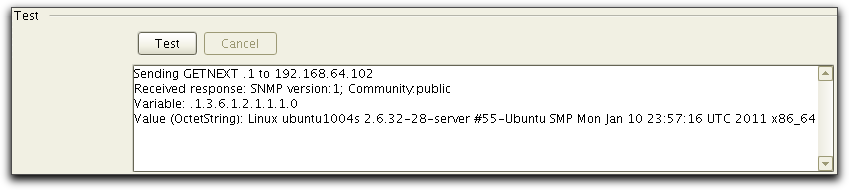
To test and verify that there is network connectivity and that a
collector is working as expected,
simply press the test button and trace information will be displayed in
the text area:
When you have a collector defined, the next step is to add resources
to be monitored. Select the collector in the tree to the left and and
choose the Edit->Create
menu option or
the button in the tool bar. For SNMP
collectors, this will bring up the SNMP browser:
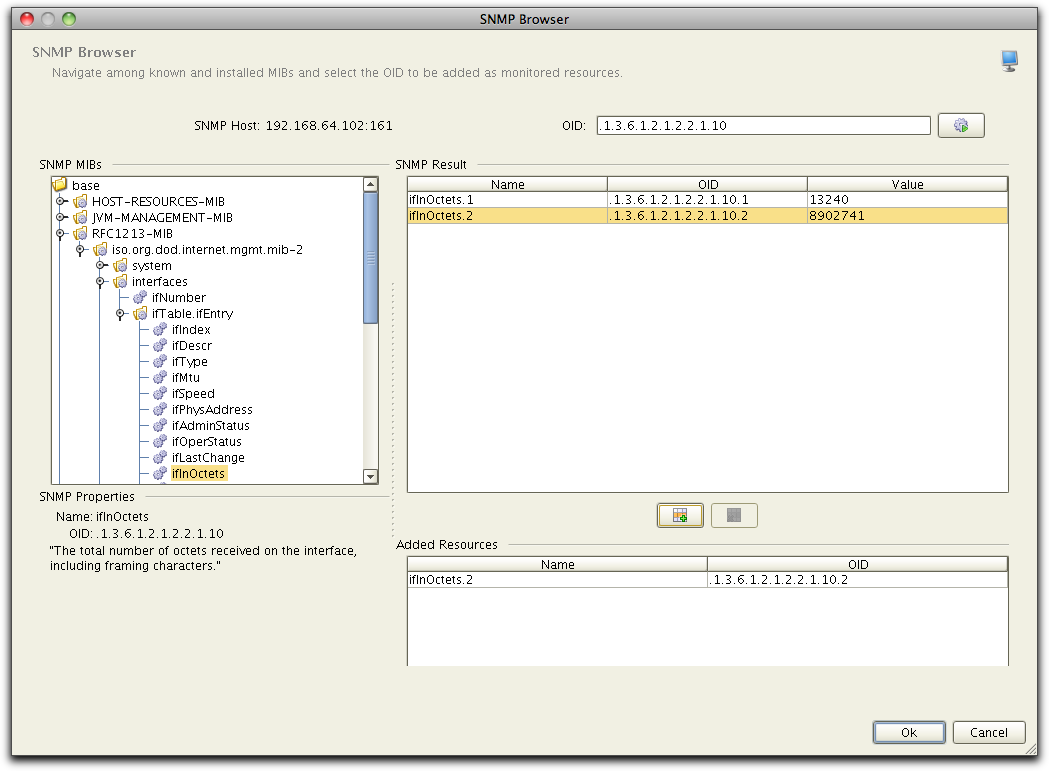
 ) button. A list of
specific OIDs and their actual current values from the SNMP host are
then shown in the SNMP Result table. Select one or more OIDs from the
result table and press the add (
) button. A list of
specific OIDs and their actual current values from the SNMP host are
then shown in the SNMP Result table. Select one or more OIDs from the
result table and press the add ( )
button
to
add them as monitored resources.
)
button
to
add them as monitored resources.The settings for a resources is shown when you select the resource
in the
tree. The following picture shows the settings for an OID resource:
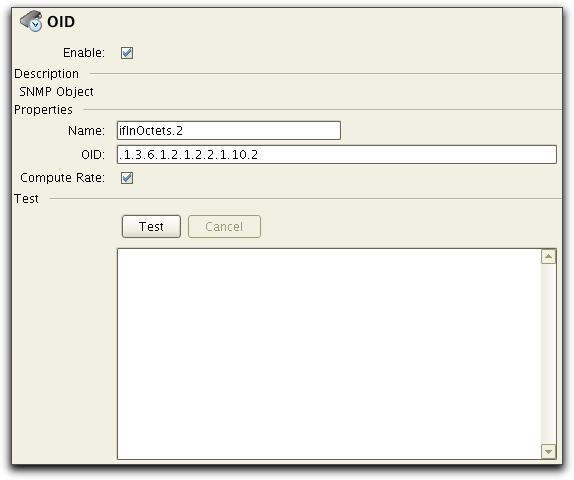
The Enable is used to
enable/disable the resource. and the Name
setting is used when
presenting results. OID is the
id of the SNMP object to monitor which was added from the SNMP Browser.
The OID can be edited manually as well.
The Compute Rate setting
controls if the rate per second should be computed and used instead of
the raw value returned by the SNMP host. This is useful for SNMP
counters where the absolute value is not of interest but rather the
change over time. Example: ifInOctets (received octets on a network
interface) is not very useful, but received octets per second is often
interesting to monitor.
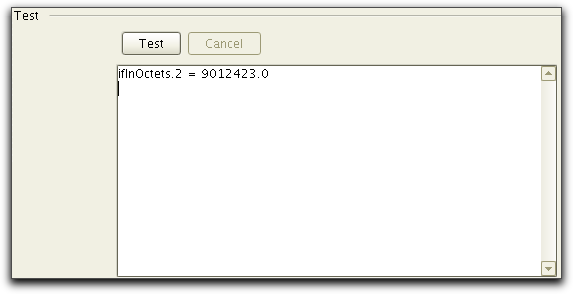
To test and verify that the resource is working as expected,
simply press the test button and trace information will be displayed in
the text area:
The settings for server resources varies depending on the OS of the
server to be monitored, but for UNIX based systems the following is
typical:
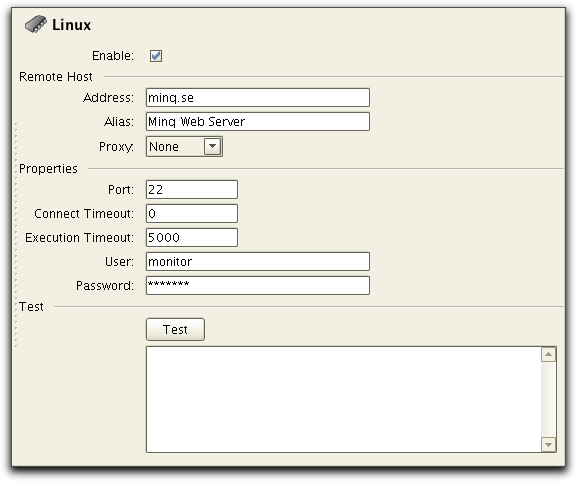
The collector properties are:
Select the Linux collector in the tree to the left and and
choose the Edit->Create
menu option or
the button in the tool bar. A list of
available Linux resources are presented in a dialog:
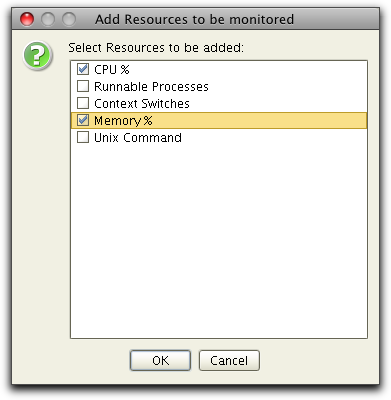
Select the resources you want to add and press OK. The list of available resources is dependent of the server OS for the collector and the version above is for a Linux collector. For details on the "Unix Command" resource, see the Custom UNIX Resources section below.
For a description of the Windows
resources see the section below.
The settings for a resources is shown when you select the resource
in the
tree.
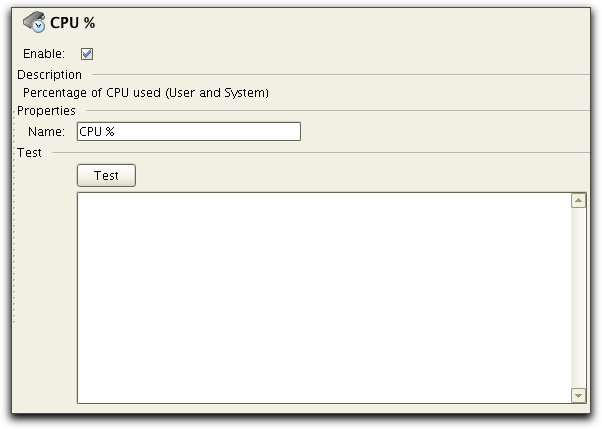
The Enable is used to
enable/disable the resource. and the Name
setting is used when
presenting results. The Test section is described below.
To test and verify that the resource is working as expected,
simply press the test button and trace information will be displayed in
the text area:
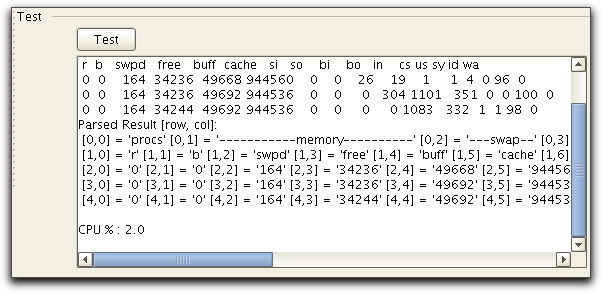
If everything work as expected, you will see information displayed
similar to the above. If results can't be parsed or any other problem
is found
a dialog will be displayed, describing the error found.
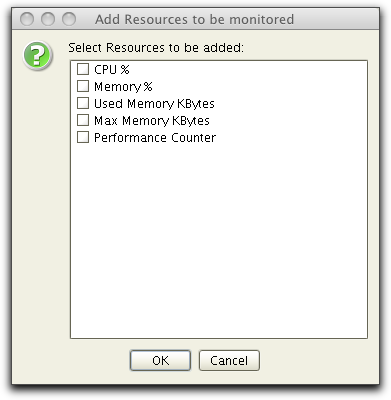
If you have installed NSClient++
you will be able to add a Windows Collector and add Windows resources
to be monitored. The Windows resources available are as shown below:
The "Performance Counter" resource allows you to monitor any Windows
Performance Counter. For example to monitor the disk space available on
the "C:" hard drive you can use the following:
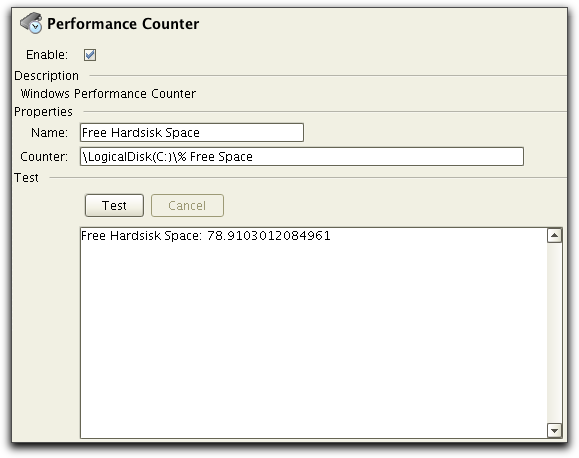
Windows Performance Counters are used to provide information as to how
well the operating system or an application, service, or driver is
performing. A counter is specified using a path specifying performance
object and counter. Examples are:
For details on Performance Counters and available Counters, please
see the Windows Documentation.
Note: Unfortunately NSClient++ returns zero (0) if a performance
counter isn't found. When adding and testing Performance Counters start
NSClient++ on the Windows server in test mode and verify that you do
not get any errors displayed on in the console.
To add non-standard resources to be monitored, the Unix Command
resource can be used. Such a resource is composed of two parts:
Select the collector in the tree to the left and and choose the Edit->Create menu option or
the button in the tool bar. A list of
resources that can be added are presented in a dialog, select the Unix Command resource. The resource
added will have the following settings:
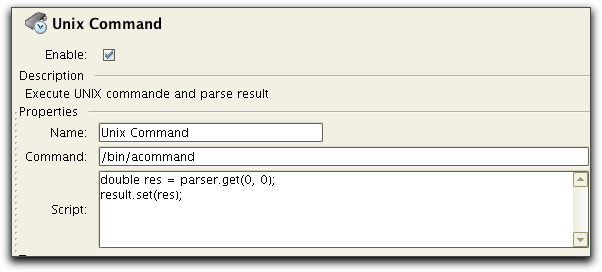
There are 3 settings to control the Unix Command resource:
The script to parse results from an executed command is based on BeanShell, a Java source
interpreter. Basically this allows using Java to specify how to read
and parse the results and also to set the result. To help there are two
variables pre-defined:
Let's say that we want to monitor used swap memory on a Linux system. To do this we executes the "free" command as follows:
% /usr/bin/free -kWe want to extract the 3'rd column from the 4'th line (164 in
the example above). To do this we specify the following:
If you specify this and test it using the Test button you will see
something like:
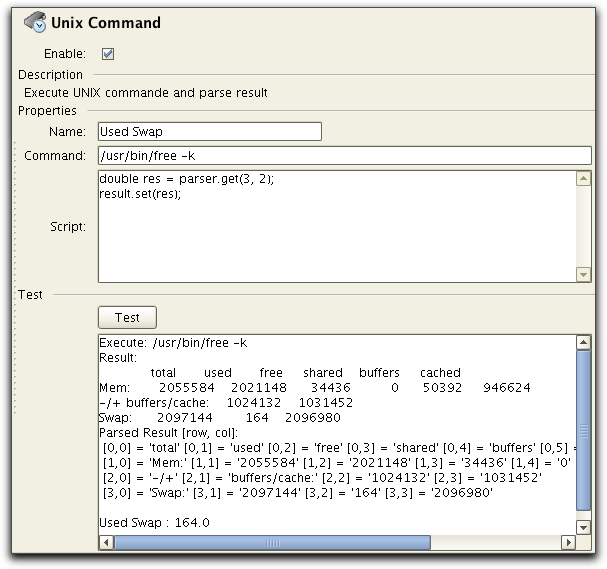
The parser support several methods, but for simple row/column access the get(in, int) method as shown above is the easiest and most common way to extract data from a command. The following methods exists:
public java.lang.String getUnparsedResult()
public void parse()
           throws com.pureload.monitor.collector.CollectException
com.pureload.monitor.collector.CollectException
- on parse errorspublic void parse(java.lang.String columnSeparator)
throws com.pureload.monitor.collector.CollectException
columnSeparator - column separator (regular
expression) com.pureload.monitor.collector.CollectException
- on parse errorspublic int getNoOfLines()
throws com.pureload.monitor.collector.CollectException
com.pureload.monitor.collector.CollectException
- on parse errorspublic java.lang.String getString(int row,
int col)
throws com.pureload.monitor.collector.CollectException
row - row index (first line is index 0)col - column index (first columnd is index 0) com.pureload.monitor.collector.CollectException
- on errorspublic double get(int row,
int col)
throws com.pureload.monitor.collector.CollectException
row - line index (first line is index 0)col - column index (first columnd is index 0) com.pureload.monitor.collector.CollectException
- on errorsInstalling NSClient++ agent is
required on all Windows servers to be monitored. These instructions
describes how to install and run the the Agent as a Windows service.
Download NSClient++ agent from: http://nsclient.org/nscp/downloads.
Windows Installers are provided as "MSI files". Download the latest
version available.
Install by executing the downloaded installer. Accept the license
agreement and choose "Next" until you come to the NSClient++
Configuration page:
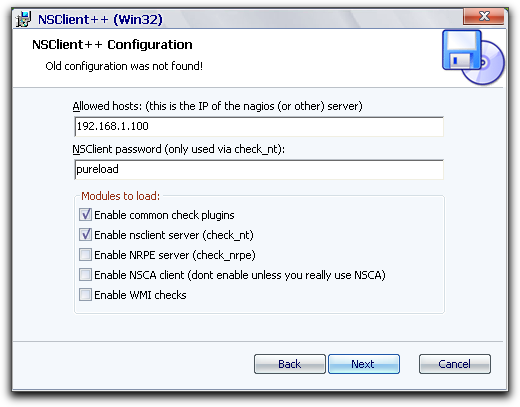
Here you must specify the following parameters:
Host name or IP address of the host where you will run the PureLoad Console.
This can be a list (comma separated) with hosts that are allowed to connect and query data. If this is empty all hosts will be allowed to query data.
The password used to access the agent. If no password is set everyone will be able to use this service remotely.
Select the first two modules as shown above. These are the only one required to be used from PureLoad.
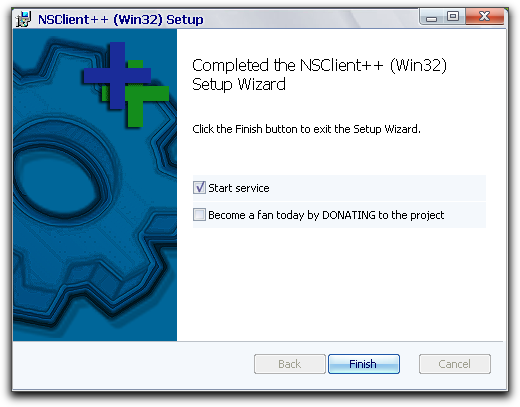
You control NSClient++ using the installed Start menu shortcuts or
using the isntalled System Service.