Documentation Index
Tools
The tools menu in PureLoad Console contains choices to quick launch
the following applications:
- HTTP Recorder
- The HTTP Recorder is used to
capture
HTTP requests between a web browser and a web application in order to
easily create PureLoad scenarios. See Testing Web
Applications for more information.
- Web Crawler
- The Web Crawler is used to examine a static web structure and
present
errors and various statistics. PureLoad scenarios can be created from
the resources that are found. See Testing Web
Applications for more information.
- Result Comparer
- The Comparer is used to graphically compare the results from one
or
several executions. Read more about the comparer below.
Result Comparer
The Result Comparer available in Tools->Result
Comparer menu is used to compare result metrics from several
load tests. This is a useful when performance enhancements has been
applied in the server application between load tests. The comparer
visualizes the Time Slot views that is presented in the Result main tab
in the console.
The comparer can also be started outside the PureLoad Console
depending on the operating system you are using:
- Windows
Locate the PureLoad submenu in the Start menu and select the PureLoad Comparer entry in the
submenu.
- Linux/Unix
Open a shell and change directory to the PureLoad installation
directory. Execute the bin/comparer
program.
Load a Result Set
Select File->Open or the  button in the tool bar.
Select the result comparer file that was previously saved using File->Export Comparer Data in the
PureLoad Console.
button in the tool bar.
Select the result comparer file that was previously saved using File->Export Comparer Data in the
PureLoad Console.
The following screen shows two loaded result sets, test_nov.cd and test_dec.cd:
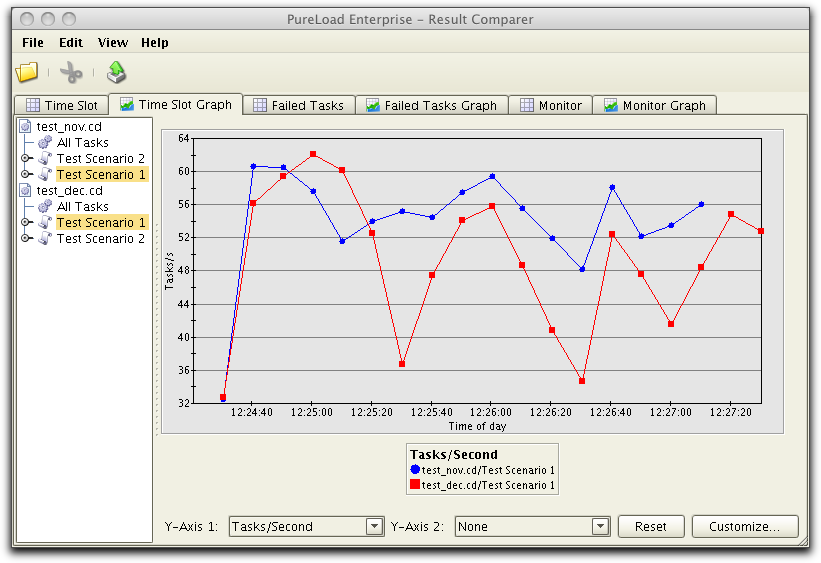
Depending on what data included in the execution, the
following views are available, by selection the appopriate tab:
- Time Slot
- Result metrics over time, in table format.
- Time Slot Graph
- Result metrics over time, in graph format.
- Failed Tasks
- Failed task information, in table format.
- Failed Tasks Graph
- Failed task information, in graph format.
- Monitor
- Monitor information, in table format.
- Monitor Graph
- Monitor information, in graph format.
By selecting information in the tree you can now compare information
from previous executions, where data has been exported in comparer
format.
The result views can also be exported in either CSV (Character
Separated
Value) format for the grid view or in PNG (Portable Network Graphic)
for the graph. Select the File->Export
menu option to export. Use the Edit->Remove
menu option or the  button in the tool bar
to remove a result set from the scenario tree.
button in the tool bar
to remove a result set from the scenario tree.
Copyright © 2015 PureLoad Software Group AB. All rights
reserved.