Overview

An Anova test is used to determine the existence, or absence of a statistically significant difference between the mean values of two or more groups of data.
Applying the Anova Test Formula
All statistical formulas are calculated using the Statistics class, the following table describes how to use its Anova method to perform an Anova test.
| |
Value/Description |
Example |
|
Formula Name: |
Anova |
Statistics.Anova (.05, "Default,Series2,Series3"). |
| Parameters: |
- probability: the alpha value (probability).
- inputSeriesNames: the names of two or more input series. Each series must exist in the series collection at the time of the method call, and have the same number of data points.
|
Statistics.Anova(.05, "Default,Series2,Series3" ) |
| Return: |
An AnovaResult object, which has the following members:
- DegreeOfFreedomBetweenGroups
- DegreeOfFreedomTotal
- DegreeOfFreedomWithinGroups
- FCriticalValue
- FRatio
- MeanSquareVarianceBetweenGroups
- MeanSquareVarianceWithinGroups
- SumOfSquaresBetweenGroups
- SumOfSquaresTotal
- SumOfSquaresWithinGroups
|
- |
 Note Note |
| Make sure that all data points have their XValue property set, and that their series' XValueIndexed property has been set to false. |
Statistical Interpretation
The purpose of an Anova test is to determine the existence, or absence of a statistically significant difference amongst several group means. Anova actually uses variances to help determine if the various means are equal or not.
To perform an Anova test three basic assumptions must be fulfilled:
- Each group from which a sample is taken is normal.
- Each group is randomly selected and independent.
- The variables from each group come from distribution with approximately equal standard deviation.
The Null and Alternative Hypotheses
The null hypothesis is simply that all group population means are the same. The alternate hypothesis is that at least one pair of means is different.
Calculation
1. Calculate the sample average for each group:
2. Calculate the average of all the averages:
3. Calculate the sample variance of the averages:
4. Calculate the sample variance for each group:
5. Calculate the average of all of the sample variances:
6. Calculate the value of the F Statistic:

Example
This example demonstrates how to perform an Anova Test, using Series1, Series2, and Series3 for the input series. The results are returned in an AnovaResult object.
| Visual Basic |
 Copy Code Copy Code |
Imports Dundas.Charting.WebControl
  ...

Dim result As AnovaResult = Chart1.DataManipulator.Statistics.Anova(.05, "Series1,Series2,Series3")
|
| C# |
Copy Code |
using Dundas.Charting.WebControl;
  ...

AnovaResult result = Chart1.DataManipulator.Statistics.Anova(.05, "Series1,Series2,Series3");
|
Example
This example demonstrates how to perform an Anova Test, using Series1, and Series2 for the input series. The results are returned in an AnovaResult object. The object values are then added as titles to a separate chart. We assume that series data was added at design-time. Further, we assume a "DundasBlue" template was applied for appearance purposes.
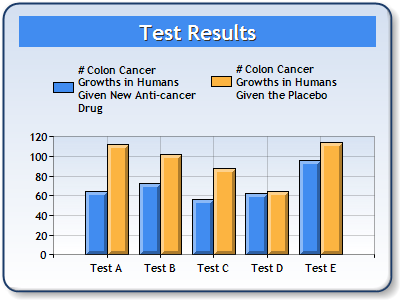 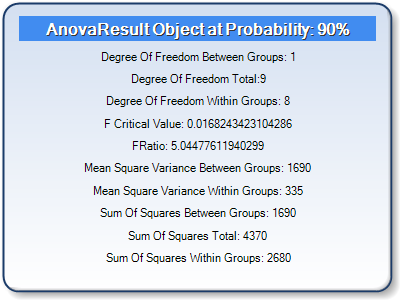 |
| Figure 1: Two Charts; One containing Series data (left), and the other containing the AnovaResult object (right). |
| Visual Basic |
Copy Code |
Imports Dundas.Charting.WebControl
  ...

' The Anova Result Object is Created
Dim result As AnovaResult =  Chart1.DataManipulator.Statistics.Anova(.9,"Series1,Series2")

' Add Title to the second chart.
Chart2.Titles.Add("AnovaResult Object at Probability: 90%")

' Change Appearance properties of the first title.
Chart2.Titles(0).BackColor = Color.FromArgb(255, 65, 140, 240)
Chart2.Titles(0).Font = New Font("Trebuchet", 12, FontStyle.Bold)
Chart2.Titles(0).Color = Color.White
Chart2.Titles(0).Style = TextStyle.Shadow

' Add All AnovaResult data to the title collection, using the ToString() method.
Chart2.Titles.Add("Degree Of Freedom Between Groups: " + result.DegreeOfFreedomBetweenGroups.ToString())
Chart2.Titles.Add("Degree Of Freedom Total:" + result.DegreeOfFreedomTotal.ToString())
Chart2.Titles.Add("Degree Of Freedom Within Groups: " + result.DegreeOfFreedomWithinGroups.ToString())
Chart2.Titles.Add("F Critical Value: " + result.FCriticalValue.ToString())
Chart2.Titles.Add("FRatio: " + result.FRatio.ToString())
Chart2.Titles.Add("Mean Square Variance Between Groups: " + result.MeanSquareVarianceBetweenGroups.ToString())
Chart2.Titles.Add("Mean Square Variance Within Groups: " + result.MeanSquareVarianceWithinGroups.ToString())
Chart2.Titles.Add("Sum Of Squares Between Groups: " + result.SumOfSquaresBetweenGroups.ToString())
Chart2.Titles.Add("Sum Of Squares Total: " + result.SumOfSquaresTotal.ToString())
Chart2.Titles.Add("Sum Of Squares Within Groups: " + result.SumOfSquaresWithinGroups.ToString())
|
| C# |
Copy Code |
using Dundas.Charting.WebControl;
  ...

// The Anova Result Object is Created
AnovaResult result = Chart1.DataManipulator.Statistics.Anova(.9, "Series1,Series2");

// Add Title to the second chart.
Chart2.Titles.Add("AnovaResult Object at Probability: 90%");

// Change Appearance properties of the first title.
Chart2.Titles[0].BackColor = Color.FromArgb(255, 65, 140, 240);
Chart2.Titles[0].Font = new Font("Trebuchet", 12, FontStyle.Bold);
Chart2.Titles[0].Color = Color.White;
Chart2.Titles[0].Style = TextStyle.Shadow;

// Add All AnovaResult data to the title collection, using the ToString() method.
Chart2.Titles.Add("Degree Of Freedom Between Groups: " + result.DegreeOfFreedomBetweenGroups.ToString());
Chart2.Titles.Add("Degree Of Freedom Total:" + result.DegreeOfFreedomTotal.ToString());
Chart2.Titles.Add("Degree Of Freedom Within Groups: " + result.DegreeOfFreedomWithinGroups.ToString());
Chart2.Titles.Add("F Critical Value: " + result.FCriticalValue.ToString());
Chart2.Titles.Add("FRatio: " + result.FRatio.ToString());
Chart2.Titles.Add("Mean Square Variance Between Groups: " + result.MeanSquareVarianceBetweenGroups.ToString());
Chart2.Titles.Add("Mean Square Variance Within Groups: " + result.MeanSquareVarianceWithinGroups.ToString());
Chart2.Titles.Add("Sum Of Squares Between Groups: " + result.SumOfSquaresBetweenGroups.ToString());
Chart2.Titles.Add("Sum Of Squares Total: " + result.SumOfSquaresTotal.ToString());
Chart2.Titles.Add("Sum Of Squares Within Groups: " + result.SumOfSquaresWithinGroups.ToString());
|
 See Also


