


Overview
There are two types of grid lines and tick marks: those that are considered to be major, and those that are considered to be minor. By default, the major grid lines and tick marks are enabled, while the minor tick marks and grid lines are not. To display minor grid lines, or tick marks, set their Enabled property to True.
The parent Axis object of tick marks and grid lines has an Interval, IntervalOffset, IntervalType, and IntervalOffsetType property. If a major grid line or tick mark has its Interval property set to the value NotSet, then by default, the parent Axis object's Interval property value is used. In any event, the property settings of the parent Axis object do not affect the interval-related properties of minor grid lines, and tick marks of an axis.
To set the IntervalType, and IntervalOffsetType properties to the value NotSet, use the value DateTimeIntervalType.NotSet.
When Axis.Interval is set to Auto, the IntervalAutoMode property determines how many intervals should be calculated. If your chart is being resized or redrawn often, you can set the IntervalAutoMode property to VariableCount, in which case the Chart will dynamically calculate axis intervals. This is especially useful in situations where the chart intervals are displayed differently depending on its data.
 Note Note |
|---|
| The Axis object cannot have its IntervalType, or IntervalOffsetType property set to the value NotSet. |
To set the IntervalType, and IntervalOffsetType properties to Auto, use a value of DateTimeIntervalType.Auto.
To set the Interval and IntervalOffset properties to Auto, use a value of zero. To set these properties to a value of NotSet, use the value Double.NaN, but remember that this is not applicable to the Axis object.
| Note |
|---|
| Grid lines and tick marks for custom axis labels, implemented using the CustomLabels property, are not affected by the interval-related properties. |
If the interval type of a grid line or tick mark object is Auto, then the Interval, and IntervalType for grid lines and tick marks will be determined automatically using the data points that have already been plotted.
The Properties of Grid Lines and Tick Marks
The following table summarizes the properties of grid lines and tick marks:
|
Grid Line and Tick Mark Properties | |
|---|---|
|
Enabled |
Grid lines and tick marks can be disabled on a per axis basis. Defaults to true for major grid lines and tick marks. Simply enabling Grid lines and Tick Marks will result in these objects automatically spaced along the axis unless the Interval property has been set. |
|
Grid line and tick mark line attributes. | |
|
Properties used for tick marks only. The Size property determines the length of a tick mark, while the Style property determines if tick marks occur outside, inside or across the relevant axis line. | |
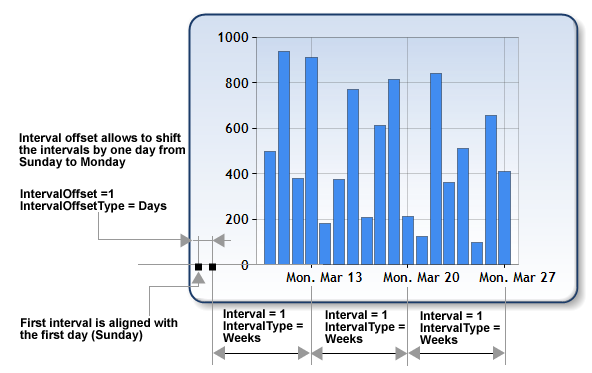
Figure 1: A pictorial representation of the interval-related properties.
Code Examples
The following code examples demonstrate many aspects of working with grid lines, and tick marks.
Example
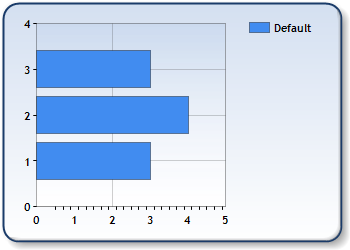
This example demonstrates how to work with different intervals, and interval offsets for grid lines, and tick marks. We use different interval-related settings for the major grid lines, and major tick marks. In this example we assume that a series of type bar chart was added at design-time along with 3 data points. We set the interval-related properties of the primary Y axis's grid lines, and tick marks. Further, we assume that the primary Y axis is being used to plot the bar chart. The DundasBlue template has been applied to the original chart shown in Figure 2 below to enhance its appearance for the purposes of this documentation.
 |
|
Figure 2: Setting intervals for grid lines and tick marks. |
| Visual Basic |  Copy Code Copy Code |
|---|---|
| |
| C# | Copy Code |
|---|---|
| |
Example
This example demonstrates how to work with major and minor grid lines using different intervals and colors. We use different interval-related settings for the major, and minor grid lines. We assume that a series of type bar chart was added at design-time along with 3 data points, and uses the primary Y axis. We set the interval-related properties of the primary Y axis' major and minor grid lines. Further, we assume that the DundasBlue template has been applied to the original chart for appearance purposes.
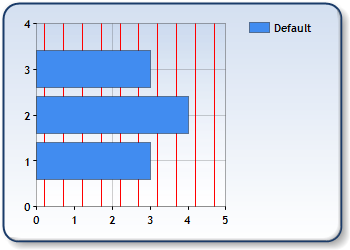 |
| Figure 3: Setting minor and major tick marks. |
| Visual Basic | Copy Code |
|---|---|
| |
| C# | Copy Code |
|---|---|
| |
Example
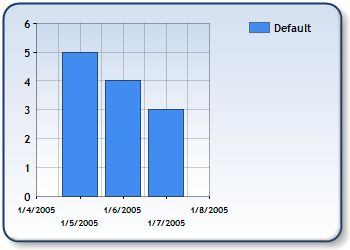
This example demonstrates how to work with automatic intervals, and the IntervalType property. We assume that a series with 3 data points has been added, and the DundasBlue template has been applied. By default, the grid lines and tick marks are set to Auto, creating the chart shown in Figure 4. A Dundas template has been applied to the chart.
|
| |
| Figure 4: Chart with automatic intervals. | |

| Visual Basic | Copy Code |
|---|---|
| |
| C# | Copy Code |
|---|---|
| |
 |
|
Figure 5: Resulting chart after interval settings are applied. |
Grid lines and Tick marks for Custom Labels
Major grid lines and major tick marks are enabled/disabled for custom axis labels using the GridTick property of the CustomLabel objects, and are displayed on a custom label by custom label basis. These major grid lines and tick marks utilize the appearance properties of the relevant Axis object's MajorTickMark and MajorGrid object properties, however, these "custom" grid lines and tick marks DO NOT utilize the interval-related properties.
 See Also
How To
Axis Types