


Overview
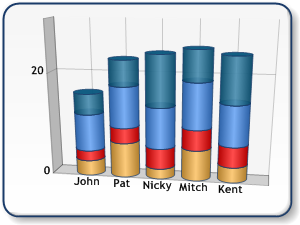
Charts are plotted using X and Y axes. Y axes are always value axes used to plot data (e.g. number of sales, etc.). X axes are normally categorical (e.g. months of the year, etc.), but can be used as value axes as well (e.g. a scatter-type plot). Refer to the diagram below for an illustration of value versus categorical axes.
 |
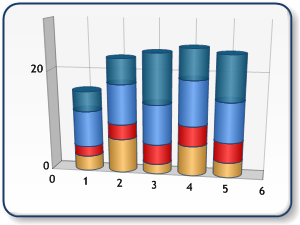 |
| Figure 1: A chart using categorical axis (shown left), and a chart using value axis (shown right). | |
There are two sets of axes: Primary and Secondary axes. Primary axes for all charts, except the bar charts, are located at the bottom (primary X axis) and left (primary Y axis) border of the chart area. The secondary axes are located at the top (secondary X axis), and right (secondary Y axis) border of the chart area as shown in Figure 2 below.
To set which axes a series is plotted against use the YAxisType and XAxisType properties of a Series object.
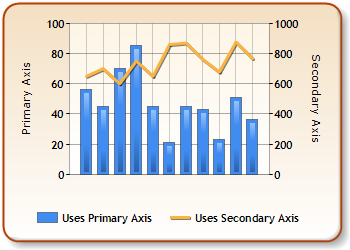
Figure 2: The primary and secondary axes.
The bar and stacked bar charts have their X, and Y axes rotated by 90 degrees. This means that the Y axes are horizontal (primary is bottom axis, secondary is top axis), and the X axes are vertical (primary is left axis, secondary is right axis). Refer to Figure 3 below for a pictorial representation of bar chart axes.
Pie and Doughnut charts do not use axes.
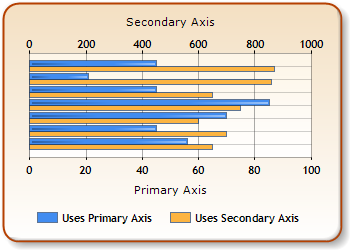
Figure 3: A bar chart's axes.
Using Multiple Axes As Sub-axes
The charting control allows you to plot your data against primary and secondary x-axes, as well as primary and secondary y-axes. Each primary and secondary axis can also contain a number of sub-axes which can be added using the SubAxis class. In short, both primary and secondary x-axes and y-axes can have their own set of sub-axes.
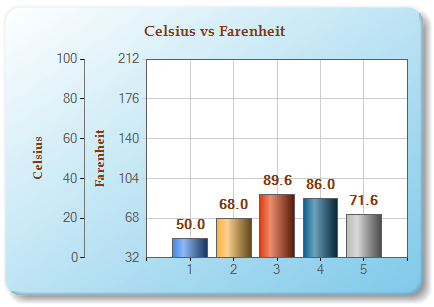
Sub-axes are useful in that they provide a means by which additional insight can be added to the data that is displayed within a chart. For example, Figure 4 below demonstrates a chart where temperatures are displayed on both the Celsius and Farenheit scales. By using a sub-axis within the primary y-axis to plot these temperature values, a user can easily see how the two temperature readings relate to each other and also to both scales. Now, a user can easily see that 68 degrees Farenheit is 20 degrees Celsius.
 |
|
Figure 4: A chart with a dollar figure plotted along its y-axis, and a percentage plotted using a sub-axis of the y-axis. |
Every axis can have its own set of sub-axes, however, each sub-axis must have its own unique name within its assigned axis collection. This means that two axes with the same name cannot exist as a parent and child (sub-axis) axis. Further, two sub-axes cannot possess the same name.
 |
Using a SubAxis on a 3D chart has no effect. |
Example
This example demonstrates how to programmatically define and use a primary and secondary y-axis with each containing its own sub-axes. This example assumes that a chart called Chart1 has been added to the project, and that a data series called mySeries exists within the project as well.
| Visual Basic |  Copy Code Copy Code |
|---|---|
|
' Create a sub-axis object called SubAxis1. Dim subAxisY As New SubAxis("SubAxis1") ' Add that sub-axis to the primary y-axis collection. Chart1.ChartAreas(0).AxisY.SubAxes.Add(subAxisY) ' Create another sub-axis object also called SubAxis1. Dim subAxisY2 As New SubAxis("SubAxis1") ' Add that sub-axis to the secondary y-axis collection. Chart1.ChartAreas(0).AxisY2.SubAxes.Add(subAxisY2) ' This code assigns our data series called mySeries ' to SubAxis1 of the primary y-axis. mySeries.YAxisType = AxisType.Primary mySeries.YSubAxisName = "SubAxis1" ' This code assigns our data series called mySeries ' to SubAxis1 of the secondary y-axis. mySeries.YAxisType = AxisType.Secondary mySeries.YSubAxisName = "SubAxis1" | |
| C# | Copy Code |
|---|---|
|
// Create a sub-axis object called SubAxis1. SubAxis subAxisY = new SubAxis("SubAxis1"); // Add that sub-axis to the primary y-axis collection. Chart1.ChartAreas[0].AxisY.SubAxes.Add(subAxisY); // Create another sub-axis object also called SubAxis1. SubAxis subAxisY2 = new SubAxis("SubAxis1"); // Add that sub-axis to the secondary y-axis collection. Chart1.ChartAreas[0].AxisY2.SubAxes.Add(subAxisY2); // This code assigns our data series called mySeries // to SubAxis1 of the primary y-axis. mySeries.YAxisType = AxisType.Primary; mySeries.YSubAxisName = "SubAxis1"; // This code assigns our data series called mySeries // to SubAxis1 of the secondary y-axis. mySeries.YAxisType = AxisType.Secondary; mySeries.YSubAxisName = "SubAxis1"; | |