


Overview
Chart pictures are composed of various elements such as Legends, Axes, Series, and other chart elements. Each chart element corresponds to an object in the Dundas Chart Web Control API.
Figure 1 below illustrates the elements of the charting control, and is followed by a brief description of each chart element.
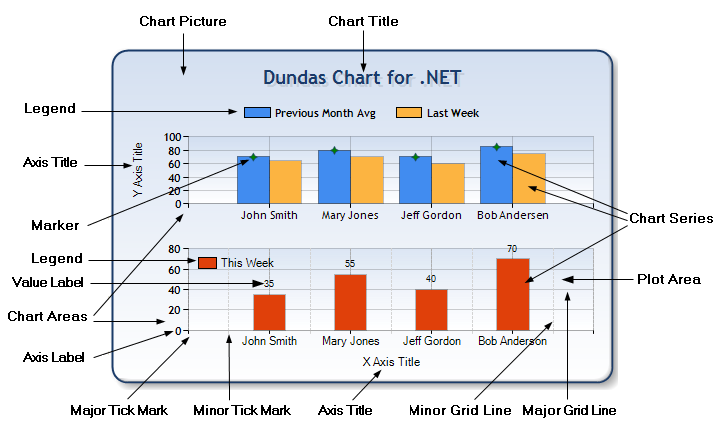
Figure 1: The Dundas charting control.
Elements of the Chart Control
Axis Label
A label along an axis. Generated automatically if no custom labels are supplied. Corresponds to the Label class.
Axis Title
The title of an axis.
Chart Area
The Chart Picture consists of one or more Chart Areas. A Chart Area is a rectangular area that is used to draw a Series, Labels, Axis, Grid Lines, Tick Marks, etc. Multiple charts can be plotted in one chart area, although this depends on the chart types involved. Corresponds to the ChartArea class.
Chart Picture
The Chart Picture, or Chart Image is the entire image that is produced, and corresponds to the root Chart class.
Chart Series
A Chart Series, usually referred to as a Series, is a related group of data points. All Series have an associated chart type. Note that the number of series that a chart can display, as well as how they are displayed, depends on the chart type being produced. See the topics in the "Chart Types" folder for further details.
Corresponds to the Series class.
Legend
A legend for the Chart Picture. There can be any number of legends for a Chart Picture, and they correspond to items in the Legend collection.
Major Grid Lines
The major horizontal and vertical grid lines, which usually occur in conjunction with Major Tick Marks. Corresponds to the Grid class.
Major Tick Marks
The major horizontal and vertical tick marks, which usually occur in conjunction with Major Grid Lines. Corresponds to the TickMark class.
Minor Grid Lines
The minor horizontal and vertical grid lines, which usually occur in conjunction with Minor Tick Marks. Corresponds to the Grid class.
Minor Tick Marks
The minor horizontal and vertical tick marks, which usually occur in conjunction with Minor Grid Lines. Corresponds to the TickMark class.
Plot Area
The Plot Area, or Plotting Area, is the inner rectangular area within a Chart Area that is used to plot a Chart Series and Grid Lines. Labels, Tick Marks, Axis Title, etc. are drawn outside of the Plotting Area (but inside the Chart Area). The Plot Area can be set using the InnerPlotPosition property.
Title
A title on the Chart Picture. There can be any number of titles placed on a chart image.
Value Label
A special label that occurs with a data point, slightly offset from where the point is plotted. It can be the data point value, or custom text.