


Overview
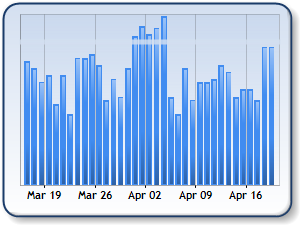
Scale breaks are intentional breaks on the y-axis that are most often used to redistribute data points on a chart. This feature improves readability when there are large differences between the high and low values of the data being plotted (Figure 1). All scale break properties are contained within the ScaleBreakStyle object of the Axis class.
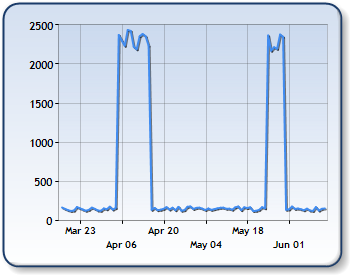
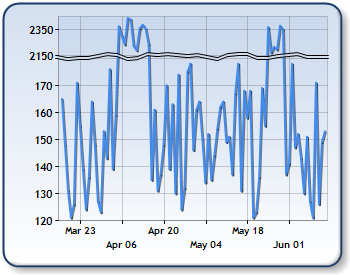
Figure 1: Charts containing data with large variations (shown left) can be shown using a scale break (shown right).
 |
The use of scale breaks is not available when using 3D charts. |
Enabling Scale Breaks
By default, scale breaks are disabled. Enabling this feature can be done by setting the ScaleBreakStyle.Enabled property to True. The default behavior for scale breaks will normally suffice for most chart users. However, you have several options to further customize the scale break, and provide a greater level of control.
Modifying Appearance
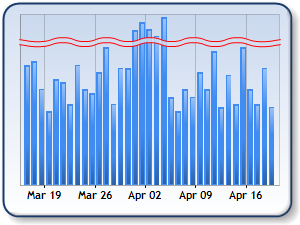
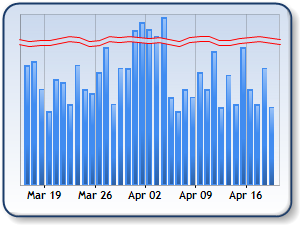
The type of scale break line to be displayed can be modified using BreakLineType (Figure 2). There are four options: wavy, ragged, straight, or none. To change the amount of vertical space of the scale break, you can specify a Spacing value. This is calculated as a percentage of the y-axis scale.
In addition to this, you can set the width and color of the scale break by setting the respective ScaleBreakStyle.LineWidth, and ScaleBreakStyle.LineColor properties.
|
|
| Figure 2: The scale break can be displayed as: wavy (shown top-left), straight (shown top-right), ragged (shown bottom-left) or none (bottom-right). |

Customizing Scale Breaks
To modify the scale break tolerance, you can specify a CollapsibleSpaceThreshold. This property is measured as a percentage of the y-axis scale, and by default, it is set to 25. This means that data points that have a difference of at least 25% of the scale will be separated with a scale break.
The ScaleBreakStyle.StartFromZero property defines whether or not to start the scale from zero when the scale break is present. When this property to Auto, the Chart will calculate the scale minimum value only if all data points are significantly far from zero. ScaleBreakStyle.StartFromZero will override AxisY.StartFromZero when the scale break is enabled.
If you wish to display more than two scale breaks, you can also set the MaxNumberOfBreaks property.
Example
This example demonstrates how to set properties relating to the scale break.
| Visual Basic |  Copy Code Copy Code |
|---|---|
| |
| C# | Copy Code |
|---|---|
| |
Scale Break Limitations
This feature is only supported along the Y and Y2 axes. Scale breaks are also not supported when using the following Chart-related features:
- Pie, doughnut, funnel, pyramid, radial or any stacked chart types.
- Custom intervals for labels, tick marks or grid lines. The minimum and maximum cannot be changed.
- Custom labels.
- Logarithmic y-axis.
- Axis views (scrolling and zooming) on the y-axis.
- 3-D charts.
 See Also
How To
Axis Types