


Overview
To plot a series against a secondary axis, the YAxisType or XAxisType property of the Series object must be set to AxisType.Secondary. The YAxisType property must be set if the y-axis being plotted is the secondary y-axis. The XAxisType property is set if the x-axis being plotted is the secondary x-axis.
If there are more than one series in a chart area, then each series may be plotted using different axes, and each axis can use a different scale.
For information on axis scales, refer to the topic on Axis Scale.
For a description of primary and secondary axes, refer to the topic on Axis Types.
Code Examples
The following code examples demonstrate many aspects of working with secondary axes.
Example
This example demonstrates how to plot a column chart against the primary X axis, and the secondary Y axis. We assume that a column chart series named "Series1" was added at design-time along with 5 data points. We then plot it against the secondary Y axis. A Dundas template has been applied to the chart. Further, we assume that the DundasBlue template has been applied to the original chart for appearance purposes.
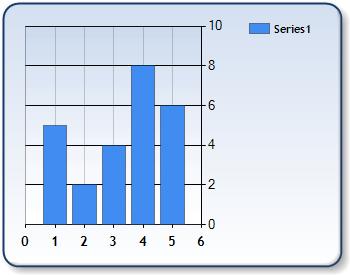
Figure 1: Secondary Axis enabled.
| Visual Basic |  Copy Code Copy Code |
|---|---|
| |
| C# | Copy Code |
|---|---|
| |
Example
This example demonstrates how to use all four axes to plot two data series. The first series will use the primary axes and the second series will use the secondary axes. Note that we use the default automatic axes scales. We assume that two column chart series named "Series1" and "Series2" were added at design-time along with 5 data points. We will also set titles for both Y axes. Further, we assume that the DundasBlue template has been applied to the original chart for appearance purposes.
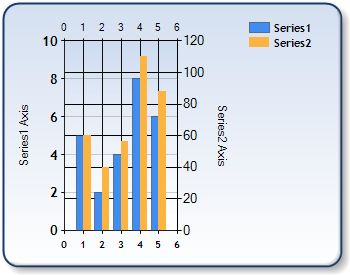
Figure 2: All Axes are enabled.
| Visual Basic | Copy Code |
|---|---|
| |
| C# | Copy Code |
|---|---|
| |
 See Also
How To
Axis Types