


Overview

This formula shows the strength of the relationship that exists between two random variables.
Applying the Formula
All statistical formulas are calculated using the Statistics class, and the following table describes how to use the Correlation method.
| Value/Description | Example | |
|---|---|---|
| Formula Name: | Correlation | Statistics.Correlation ("Series1", "Series2") |
| Parameters: | Statistics.Correlation("Series1", "Series2") | |
| Return: | A double that represents the correlation value between the two groups of data. |
|
 Note Note |
|---|
| Make sure that all data points have their XValue property set, and that their series' XValueIndexed property has been set to false. |
Statistical Interpretation
The correlation value is always between -1 and 1, and if X and Y are completely independent their correlation is zero. If the correlation coefficient is positive then when X is large, Y will also be large, and they are then said to be positively correlated. The more closely related X and Y are, the closer the correlation coefficient is to 1. On the other hand, if the correlation is negative, then Y is more likely to be small when X is big. They are then negatively correlated, and the negative relationship is stronger the closer the correlation coefficient is to 1.
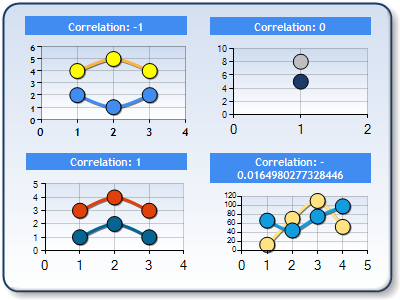 |
| Figure 1: Four chart areas, composed of two data series each; chartarea1 (top-left) is negatively correlated, chartarea2 (bottom-left) is positively correlated, chartarea3 (top-right) has a no correlation, and chartarea4 (bottom-right) has a negative correlation of 0.0164, |
The definition of the correlation coefficient is the following:
Example
This example demonstrates how to get the correlation coefficient between two groups of data (Series1 and Series2). and return the result as a double.
| Visual Basic |  Copy Code Copy Code |
|---|---|
| |
| C# | Copy Code |
|---|---|
| |
 See Also
Formulas
Formulas Overview
Statistical Formulas
Using Statistical Formulas