


Gets or sets the threshold at which all data points are collected into one point.
| Visual Basic |  Copy Code Copy Code |
|---|---|
|
|
| C# | Copy Code |
|---|---|
|
|
Remarks
This custom attribute can be set as a percentage of the total series values or as a simple value, based on the CollectedThresholdUsePercent attribute.
 Note Note |
|---|
| There must be at least two points below the threshold value in order for the Chart to collect pie slices. |
|
Custom Attribute Summary |
|
|---|---|
| Possible Values: | Any double between 0 to 100 if CollectedThresholdUsePercent is true, otherwise any double > 0 |
| Default Value: | 0 |
| 2D / 3D Limitations: | No |
| Applies to Chart Element: | Series Objects |
| Applies to Chart Types: | Pie, Doughnut |
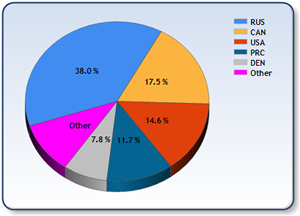
In Figure 1, we show an example of a pie chart with CollectedThreshold set to 5 and CollectedThresholdUsePercent set to True. This means any value below 5% will be collected into one pie slice.
 |
 |
|
Figure 1: Setting the CollectedThreshold attribute to 5 will group together all values less than 5. The pie chart on the left shows the values where the attribute is set to False, the one on the right is the result of setting this attribute to True. All values less than 5 are collected into one pie slice marked "Other". |
|
 See Also
Custom Attributes
Custom Attributes Overview
Chart Types
Pie Chart
Doughnut Chart