


Overview
All 3D bar and column-type charts, including Gantt charts, can be displayed using a cylindrical shape to represent their data points. The cylindrical shapes used can be applied to either an entire data series, or to a specific data point within a series. The resulting chart is seen in Figure 1 below.
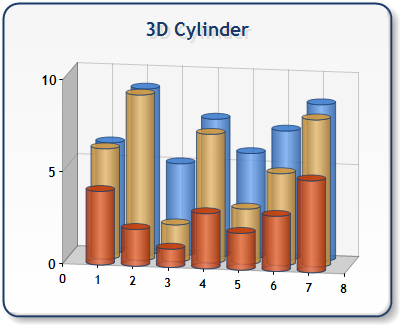
Figure 1: 3D cylinders applied to data points and series.
To use cylindrical shapes, you must use the CustomAttributes property, and set its DrawingStyle custom attribute to Cylinder. This attribute can be set at either design-time as shown in Figure 2, or at run-time as demonstrated in the code example below. To apply cylindrical shapes to a single data point, use the CustomAttributes property of that DataPoint object. To apply cylindrical shapes to all data points in a Series, use the CustomAttributes property of that Series object.
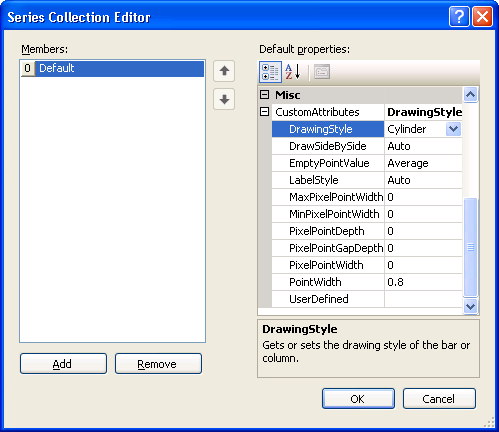
Figure 2: Setting the DrawingStyle custom attribute for a series at design-time.
Note that there are two ways to set, and get, custom attributes at run-time:
- Using an indexer. If you use an indexer do not specify the CustomAttributes property. When you set a custom attribute this way only that particular attribute (name/value pair) will be set, or retrieved.
- Using the entire CustomAttributes name-value pair string expression. When you set custom attributes this way, all custom attributes of the object are set at once. Multiple custom attributes can be set using comma separated name-value pairs. When you get the CustomAttributes property value, you will be getting the entire name-value string expression.
 |
The 3D Cylinder chart cannot be rendered using a Flash image type. |
For more information on how to set or get custom attributes, see the topic on Custom Attributes.
Code Samples
Example
This example demonstrates how to use a cylinder-shape for the first and second data points in Series1, and all the data points for Series2. Note that we do this in two ways, first we set only the DrawingStyle custom attribute, then we overwrite all attributes with the DrawingStyle attribute.
| Visual Basic |  Copy Code Copy Code |
|---|---|
|
|
| C# | Copy Code |
|---|---|
|
|
 See Also
Chart Types
Chart Types Overview
Cylinder Chart
How To
Working with 3D Charts