


Overview
3D charts are displayed on a chart area-by-chart area basis, and it is possible to display both 2D, and 3D chart areas within the same chart image. 3D charts support all 2D features except for the following:
- Gradient colors.
- Hatching
- Image-related properties (e.g. BackImage).
Summary of Classes used for 3D Charts
The display of 3D chart areas, as well as their rotation and style are implemented using the ChartArea3DStyle class, which is exposed as the Area3DStyle property of ChartArea objects. The Point3D class is used for the coordinates of 3D points, and the ChartArea class has methods to help transform these 3D points so that they can be used for custom drawing methods. To enable the 3D display of a chart area, set its Enable3D property to True. This can be done at either at design-time, or at run-time.
Example
This example demonstrates the syntax used to enable 3D for the default chart area.
| Visual Basic |  Copy Code Copy Code |
|---|---|
| |
| C# | Copy Code |
|---|---|
| |
Rotation and View Angles
The rotation of a chart is determined by the XAngle and YAngle properties, and these properties are measured in degrees. A positive XAngle will rotate the chart counter-clockwise around the horizontal axis, and a positive YAngle will rotate the chart clockwise around the vertical axis. The allowable range for Y angle rotation is -180 to 180 degrees, and -90 to 90 degrees for X angle rotation.
It is important to note that displaying the chart as an isometric projection (accomplished by having the RightAngleAxes property set to True) will result in perceived angles of rotation that may differ from the XAngle and YAngle property values. This occurs because an isometric projection does not display an authentic 3D view.
If your application allows end-users to rotate chart areas using these two properties, then we do not recommend using isometric projections, since the rotation may be unreliable, and not smooth.
Example
This example demonstrates how to set the rotation of the default chart area to 45 degrees around the vertical and horizontal axes.
| Visual Basic | Copy Code |
|---|---|
| |
| C# | Copy Code |
|---|---|
| |
Perspective
The amount of perspective in a chart is determined by the Perspective property, and the allowable range is 0-100 percent, the default being zero percent.
Setting Perspective will result in the RightAngleAxes property being set to False (they are mutually exclusive).
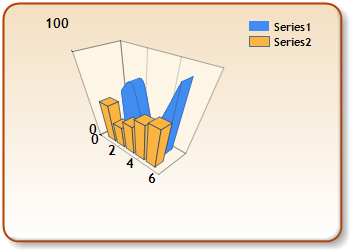
Figure 1: A chart showing perspective.
Isometric Projection
An isometric projection of a chart area is a view where the chart area axes are displayed at right angles to each other.
Isometric projections are displayed by setting the RightAngleAxes property to True, and if set to True the Perspective property will be reset to zero (they are mutually exclusive).
Please note the following points concerning isometric projection:
- it is not "real" 3D (i.e. the angle of rotation around axes doesn't use true rotational angles).
- it is ideal for displaying 3D charts where the developer just wants to show some depth.
- if your application allows end-users to rotate charts then the rotation will not be smooth. In this case we do not recommend using isometric projection.
View Depth
There are two properties that effect the view depth: PointDepth and PointGapDepth. The PointDepth is the depth of data points (e.g. the thickness of an area chart) and is measured as a percentage of the data point width. The PointGapDepth represents the distance between data series that are displayed along different rows (i.e. series with different Z positions), and is measured as a percentage of the distance between data points in one row. See figure 1 below for an illustration of these properties.
Figure 2: PointDepth and PointGapDepth.
Note that all series, regardless of chart types, have depth which may or may not be utilized to draw data points. For example, a column chart series uses it entire depth to draw the columns, while a point chart series does not use its entire depth to draw the points.
Both properties have allowable ranges of 0-1000%.
Example
This example demonstrates how to set the PointDepth, and PointGapDepth properties.
| Visual Basic | Copy Code |
|---|---|
| |
| C# | Copy Code |
|---|---|
| |
Clustering
When multiple series for bar or column charts are clustered they are displayed along two distinct rows in a chart area (i.e. each row has a distinct Z position). If the series are not clustered then their corresponding data points (i.e. data points with either the same data point collection index or X values) are then displayed adjacent to each other in one row.
Clustering only applies to bar and column charts, and is controlled by the Clustered property.
Lighting
Lighting is set by the Light property, and can be set to one of three LightStyle enumeration values:
- None - No lighting effects.
- Simplistic - The hue of all chart area elements (e.g. backwall, side walls, etc.) is fixed.
- Realistic - A realistic lighting style is applied, and the hue of all chart area elements (e.g. backwall, side walls, etc.) changes depending on the amount of rotation.
Realistic lighting will affect data points differently, depending on the type of chart being displayed.
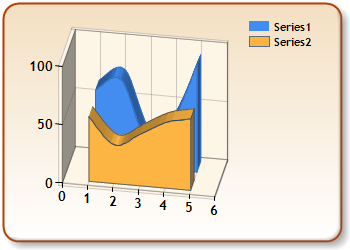
Figure 3: A chart using realistic lighting.
Example
This example demonstrates how to specify realistic lighting for the default chart area.
| Visual Basic | Copy Code |
|---|---|
| |
| C# | Copy Code |
|---|---|
| |
Wall Width
The width of a chart area's walls is set by the WallWidth property. It is measured in pixels, and the allowable range is 0-30 pixels.
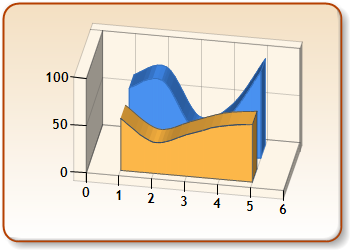
Figure 4: A chart demonstrating wall width.
Marker Lines
Marker lines are vertical and/or horizontal lines that indicate to end-users the exact locations of data points, and the type of marker line displayed depends on the chart type being shown. For example, area charts will have both horizontal and vertical marker lines, while a line chart will only have horizontal lines.
Marker lines are displayed using the ShowMarkerLines custom attribute, which is implemented using the CustomAttributes property.
Markers can be shown for single data points or entire data series, and can be used for the following chart types: all area-type charts, line charts, spline-type charts and range-type charts.
If the BorderColor property of a plotted series is set then the marker lines will use this specified color. If BorderColor is not set then the color of marker lines for the series will automatically be determined by the control, and will be slightly darker than the color of the series.
Example
This example demonstrates how to specify that marker lines are to be drawn for a series named "Default". Note that we only set the ShowMarkerLines custom attribute as opposed to setting all custom attributes using one method call.
| Visual Basic | Copy Code |
|---|---|
| |
| C# | Copy Code |
|---|---|
| |
Custom Drawing and 3D
Please note that following points concerning custom drawing and 3D chart areas:
- Custom drawing routines should be used in the Chart's PostPaint, or PrePaint events (the same is true for 2D charts). However, unlike 2D charts these two events are not raised for 3D series and datapoint objects.
- Custom drawing with 3D charts differs from custom drawing and 2D charts. This is because points in 3D charts have X, Y and Z values but custom drawing using GDI+ methods only take X and Y pixel coordinates. As a result 3D data points must be transformed so that new X and Y values are created for 3D points (the new X and Y coordinates will be transformed to reflect the 3D view).
- If end-users are allowed to rotate the chart then custom drawing may be obscured by data points, chart walls, etc. It is up to the developer to decide whether or not custom drawing should be displayed (usually the deciding criteria is the degree of rotation).
- Custom drawing can occur in front of or behind chart areas using Z coordinates greater than 100 or less than 0, respectively.
 |
Scrolling and Zooming functionality is not available when using 3D charts. |
|
The use of scale breaks is not available when using 3D charts. |
In order to perform custom drawing for 3D charts perform the following steps:
- Determine the relative X, Y and Z coordinates for all points used in GDI+ method calls (see sample code below).
The Axis class provides several utility methods to help get relative X and Y axis values. For example, use the Axis.ValueToPosition method to return a relative X or Y coordinate for a given axis value. Note that for bar-type charts the Y axis is horizontal and the X axis is vertical. GDI+ methods always have a vertical Y coordinate and horizontal X coordinate, so to get the X coordinate for bar-type charts from an axis value use an AxisY method, and vice-versa.
Relative Z values can be obtained for series using the GetSeriesZPosition and GetSeriesDepth methods. GetSeriesZPosition returns the z coordinate for a given series, and is measured from the backwall of a chart area to the center of the given series. The GetSeriesDepth method returns the depth of a given series. Note that all series, regardless of the chart type, have depth which may or may not be utilized to draw data points. For example, a column chart series uses it entire depth to draw the columns, while a point chart series does not use its entire depth to draw the points.
- Transform the 3D Coordinates. All 3D coordinates must be converted into 2D coordinates. To do this use the TransformPoints method, which takes an array of Point3D objects with relative X, Y, and Z coordinates and then transforms those points so that they have relative 2-dimensional coordinates (i.e. the X and Y properties are changed to reflect the 3-dimensional view, and the Z property is then disregarded).
- Convert all relative coordinates to absolute pixel coordinates. The chart uses a relative coordinate system, with the top-left corner of the entire chart image at position 0,0 and the bottom-right corner at position 100,100 (for more information on the chart's coordinate system see the Chart Coordinate System topic). GDI+ methods, however, require absolute pixel coordinates. With absolute pixel coordinates the top-left corner of the chart image is at 0, 0 and the bottom-right position is at "Width, Height", measured in pixels.
There are several conversion methods provided by the ChartGraphics class that will change relative chart coordinates to absolute coordinates. For example, ChartGraphics.GetAbsolutePoint takes a PointF structure that has relative coordinates, and converts it so that it uses absolute pixel coordinates (the PointF structure can then be used by any GDI+ method that uses a PointF structure).
Example
This example demonstrates how to draw a custom line from the 2nd data point in the first plotted series to the 3rd data point of the second plotted series. We assume that there are two data series, both of which are point charts. It is also assumed that the chart area is clustered, so the point charts are displayed along different rows.
| Visual Basic | Copy Code |
|---|---|
| |
| C# | Copy Code |
|---|---|
| |